DOD vs OOP ECS Benchmark Results – SIMD Performance Analysis (R1, R5, R10)
Created:
Sat 10 January 2026written by Xavier Figuera
Last modification:
Sat 10 January 2026System & Benchmark Setup
# Run Timestamp: 2025-12-26 13:44:36
# ================== CPU INFO ====================
# Architecture       : x86_64
# Manufacturer       : GenuineIntel
# Model              : Intel(R) Xeon(R) CPU E3-1245 v6 @ 3.70GHz
# Logical Threads    : 8
# Physical Cores     : 4
# ================================================
# Compiler: MSVC Visual Studio 2022 1944
# Platform: Windows x64
# Optimization: O2
# Repetitions 1 per benchmark
# Repetitions 5 per benchmark
# Repetitions 10 per benchmark
# ================================================
Benchmark Summary Across Repetition Counts
Legend:
- OOP-Pure — Traditional object-oriented implementation
- DOD-Scalar — Data-Oriented Design, scalar version
- DOD-SSE — Data-Oriented Design with SSE SIMD
- DOD-AVX — Data-Oriented Design with AVX SIMD
Cell format:
Mean / Min / Max / StdDev — all times in seconds (s)
- Mean: Average execution time across N repetitions
- Min: Minimum execution time observed
- Max: Maximum execution time observed
- StdDev: Population standard deviation across repetitions
Reps column: Number of repetitions performed for that benchmark (1, 5, or 10)
Cell format: Mean/Min/Max/StdDev — all times in seconds (s)
| Entities | Reps | OOP-Pure Mean /Min/Max/StdDev (s) | DOD-Scalar Mean/Min/Max/StdDev (s) | DOD-SSE Mean/Min/Max/StdDev (s) | DOD-AVX Mean/Min/Max/StdDev (s) |
|---|---|---|---|---|---|
| 10,000,000 | 1 | 0.0701/0.0701/0.0701/0.0000 | 0.0175/0.0175/0.0175/0.0000 | 0.0143/0.0143/0.0143/0.0000 | 0.0139/0.0139/0.0139/0.0000 |
| 10,000,000 | 5 | 0.0716/0.0690/0.0759/0.0025 | 0.0190/0.0184/0.0196/0.0005 | 0.0145/0.0142/0.0156/0.0005 | 0.0140/0.0138/0.0144/0.0002 |
| 10,000,000 | 10 | 0.0762/0.0688/0.0939/0.0070 | 0.0213/0.0178/0.0372/0.0055 | 0.0159/0.0142/0.0204/0.0019 | 0.0153/0.0136/0.0181/0.0016 |
| 20,000,000 | 1 | 0.2100/0.2100/0.2100/0.0000 | 0.0492/0.0492/0.0492/0.0000 | 0.0287/0.0287/0.0287/0.0000 | 0.0275/0.0275/0.0275/0.0000 |
| 20,000,000 | 5 | 0.2257/0.2103/0.2465/0.0126 | 0.0412/0.0386/0.0480/0.0035 | 0.0356/0.0300/0.0480/0.0065 | 0.0325/0.0310/0.0347/0.0012 |
| 20,000,000 | 10 | 0.2224/0.2120/0.2478/0.0113 | 0.0386/0.0361/0.0498/0.0038 | 0.0342/0.0301/0.0391/0.0026 | 0.0350/0.0301/0.0427/0.0036 |
| 30,000,000 | 1 | 0.4526/0.4526/0.4526/0.0000 | 0.0875/0.0875/0.0875/0.0000 | 0.0478/0.0478/0.0478/0.0000 | 0.0569/0.0569/0.0569/0.0000 |
| 30,000,000 | 5 | 0.4375/0.4154/0.4693/0.0206 | 0.0626/0.0539/0.0781/0.0100 | 0.0544/0.0456/0.0760/0.0110 | 0.0490/0.0473/0.0509/0.0012 |
| 30,000,000 | 10 | 0.4330/0.4132/0.4876/0.0221 | 0.0588/0.0539/0.0861/0.0093 | 0.0488/0.0446/0.0500/0.0015 | 0.0486/0.0466/0.0543/0.0027 |
| 40,000,000 | 1 | 0.8167/0.8167/0.8167/0.0000 | 0.0737/0.0737/0.0737/0.0000 | 0.0816/0.0816/0.0816/0.0000 | 0.0574/0.0574/0.0574/0.0000 |
| 40,000,000 | 5 | 0.7341/0.6921/0.8205/0.0451 | 0.0827/0.0760/0.1004/0.0090 | 0.0698/0.0589/0.0834/0.0100 | 0.0646/0.0589/0.0729/0.0046 |
| 40,000,000 | 10 | 0.7186/0.6856/0.7796/0.0323 | 0.0765/0.0707/0.0991/0.0079 | 0.0642/0.0587/0.0794/0.0061 | 0.0628/0.0606/0.0707/0.0030 |
| 50,000,000 | 1 | 6.4114/6.4114/6.4114/0.0000 | 0.4151/0.4151/0.4151/0.0000 | 0.1247/0.1247/0.1247/0.0000 | 0.1201/0.1201/0.1201/0.0000 |
| 50,000,000 | 5 | 2.2936/1.0400/6.2526/2.0003 | 0.2101/0.0949/0.5862/0.1890 | 0.1623/0.0740/0.4509/0.1455 | 0.0949/0.0735/0.1234/0.0225 |
| 50,000,000 | 10 | 1.6780/1.0339/6.3149/1.5514 | 0.1125/0.0952/0.1449/0.0188 | 0.0919/0.0751/0.1319/0.0194 | 0.0887/0.0757/0.1204/0.0162 |
Comparative Analysis of Benchmark Results (1, 5, and 10 repetitions)
The benchmark dataset provides a detailed comparison between four approaches for updating large numbers of entities: OOP-Pure, DOD-Scalar, DOD-SSE, and DOD-AVX. The measurements are presented for 1, 5, and 10 repetitions and entity counts ranging from 10M to 50M. Each entry records Mean, Min, Max, and StdDev of execution times in seconds.
Observations on Execution Time
-
Single Repetition (1 run):
- Even with a single run, there is a noticeable performance gap between OOP-Pure and all DOD-based approaches.
- OOP-Pure scales poorly: at 50M entities, it takes 6.4114 s, while DOD-Scalar is 0.4151 s, DOD-SSE 0.1247 s, and DOD-AVX 0.1201 s.
- SIMD acceleration (SSE and AVX) drastically reduces execution time, highlighting the efficiency of vectorized data processing.
-
Five Repetitions:
- The mean values stabilize slightly compared to a single repetition.
- Standard deviations indicate variability; OOP-Pure shows the largest fluctuations, particularly at 50M entities (StdDev = 2.0003 s), whereas DOD-AVX remains very consistent (0.0225 s).
- The gap between DOD-Scalar, DOD-SSE, and DOD-AVX is clearer with increasing entities, emphasizing the importance of SIMD for high workloads.
-
Ten Repetitions:
- Longer measurement sequences highlight performance consistency.
- OOP-Pure still exhibits extreme variability at high entity counts (e.g., Max = 6.3149 s at 50M), confirming instability under large workloads.
- DOD approaches maintain low variability; AVX consistently achieves the best mean performance across all entity counts.
- DOD-SSE also improves over DOD-Scalar, but the difference is smaller than the jump from OOP-Pure to DOD-Scalar.
Trend Analysis
-
Scalability:
All DOD-based approaches scale significantly better than OOP-Pure. While DOD methods show an almost linear increase in execution time as the umber of entities grows, OOP-Pure experiences a disproportionate increase in execution time, particularly at 50 million entities. This indicates that the OOP-based implementation becomes increasingly inefficient as the workload grows. -
Effect of SIMD:
Vectorization (SSE and AVX) further reduces execution time, particularly for larger datasets. DOD-AVX consistently outperforms DOD-SSE and DOD-Scalar, demonstrating that SIMD efficiently leverages CPU capabilities for parallel data updates. -
Stability:
Standard deviation and Min/Max ranges reveal that DOD approaches are far more stable than OOP-Pure. Even with 10 repetitions, DOD-AVX shows minimal deviation, whereas OOP-Pure exhibits significant variability, which could cause unpredictable performance in real-world scenarios.
Benchmark Graphs
The following figures provide a visual understanding of the results:
Repetitions 1
Repetitions 5
Repetititons 10

-
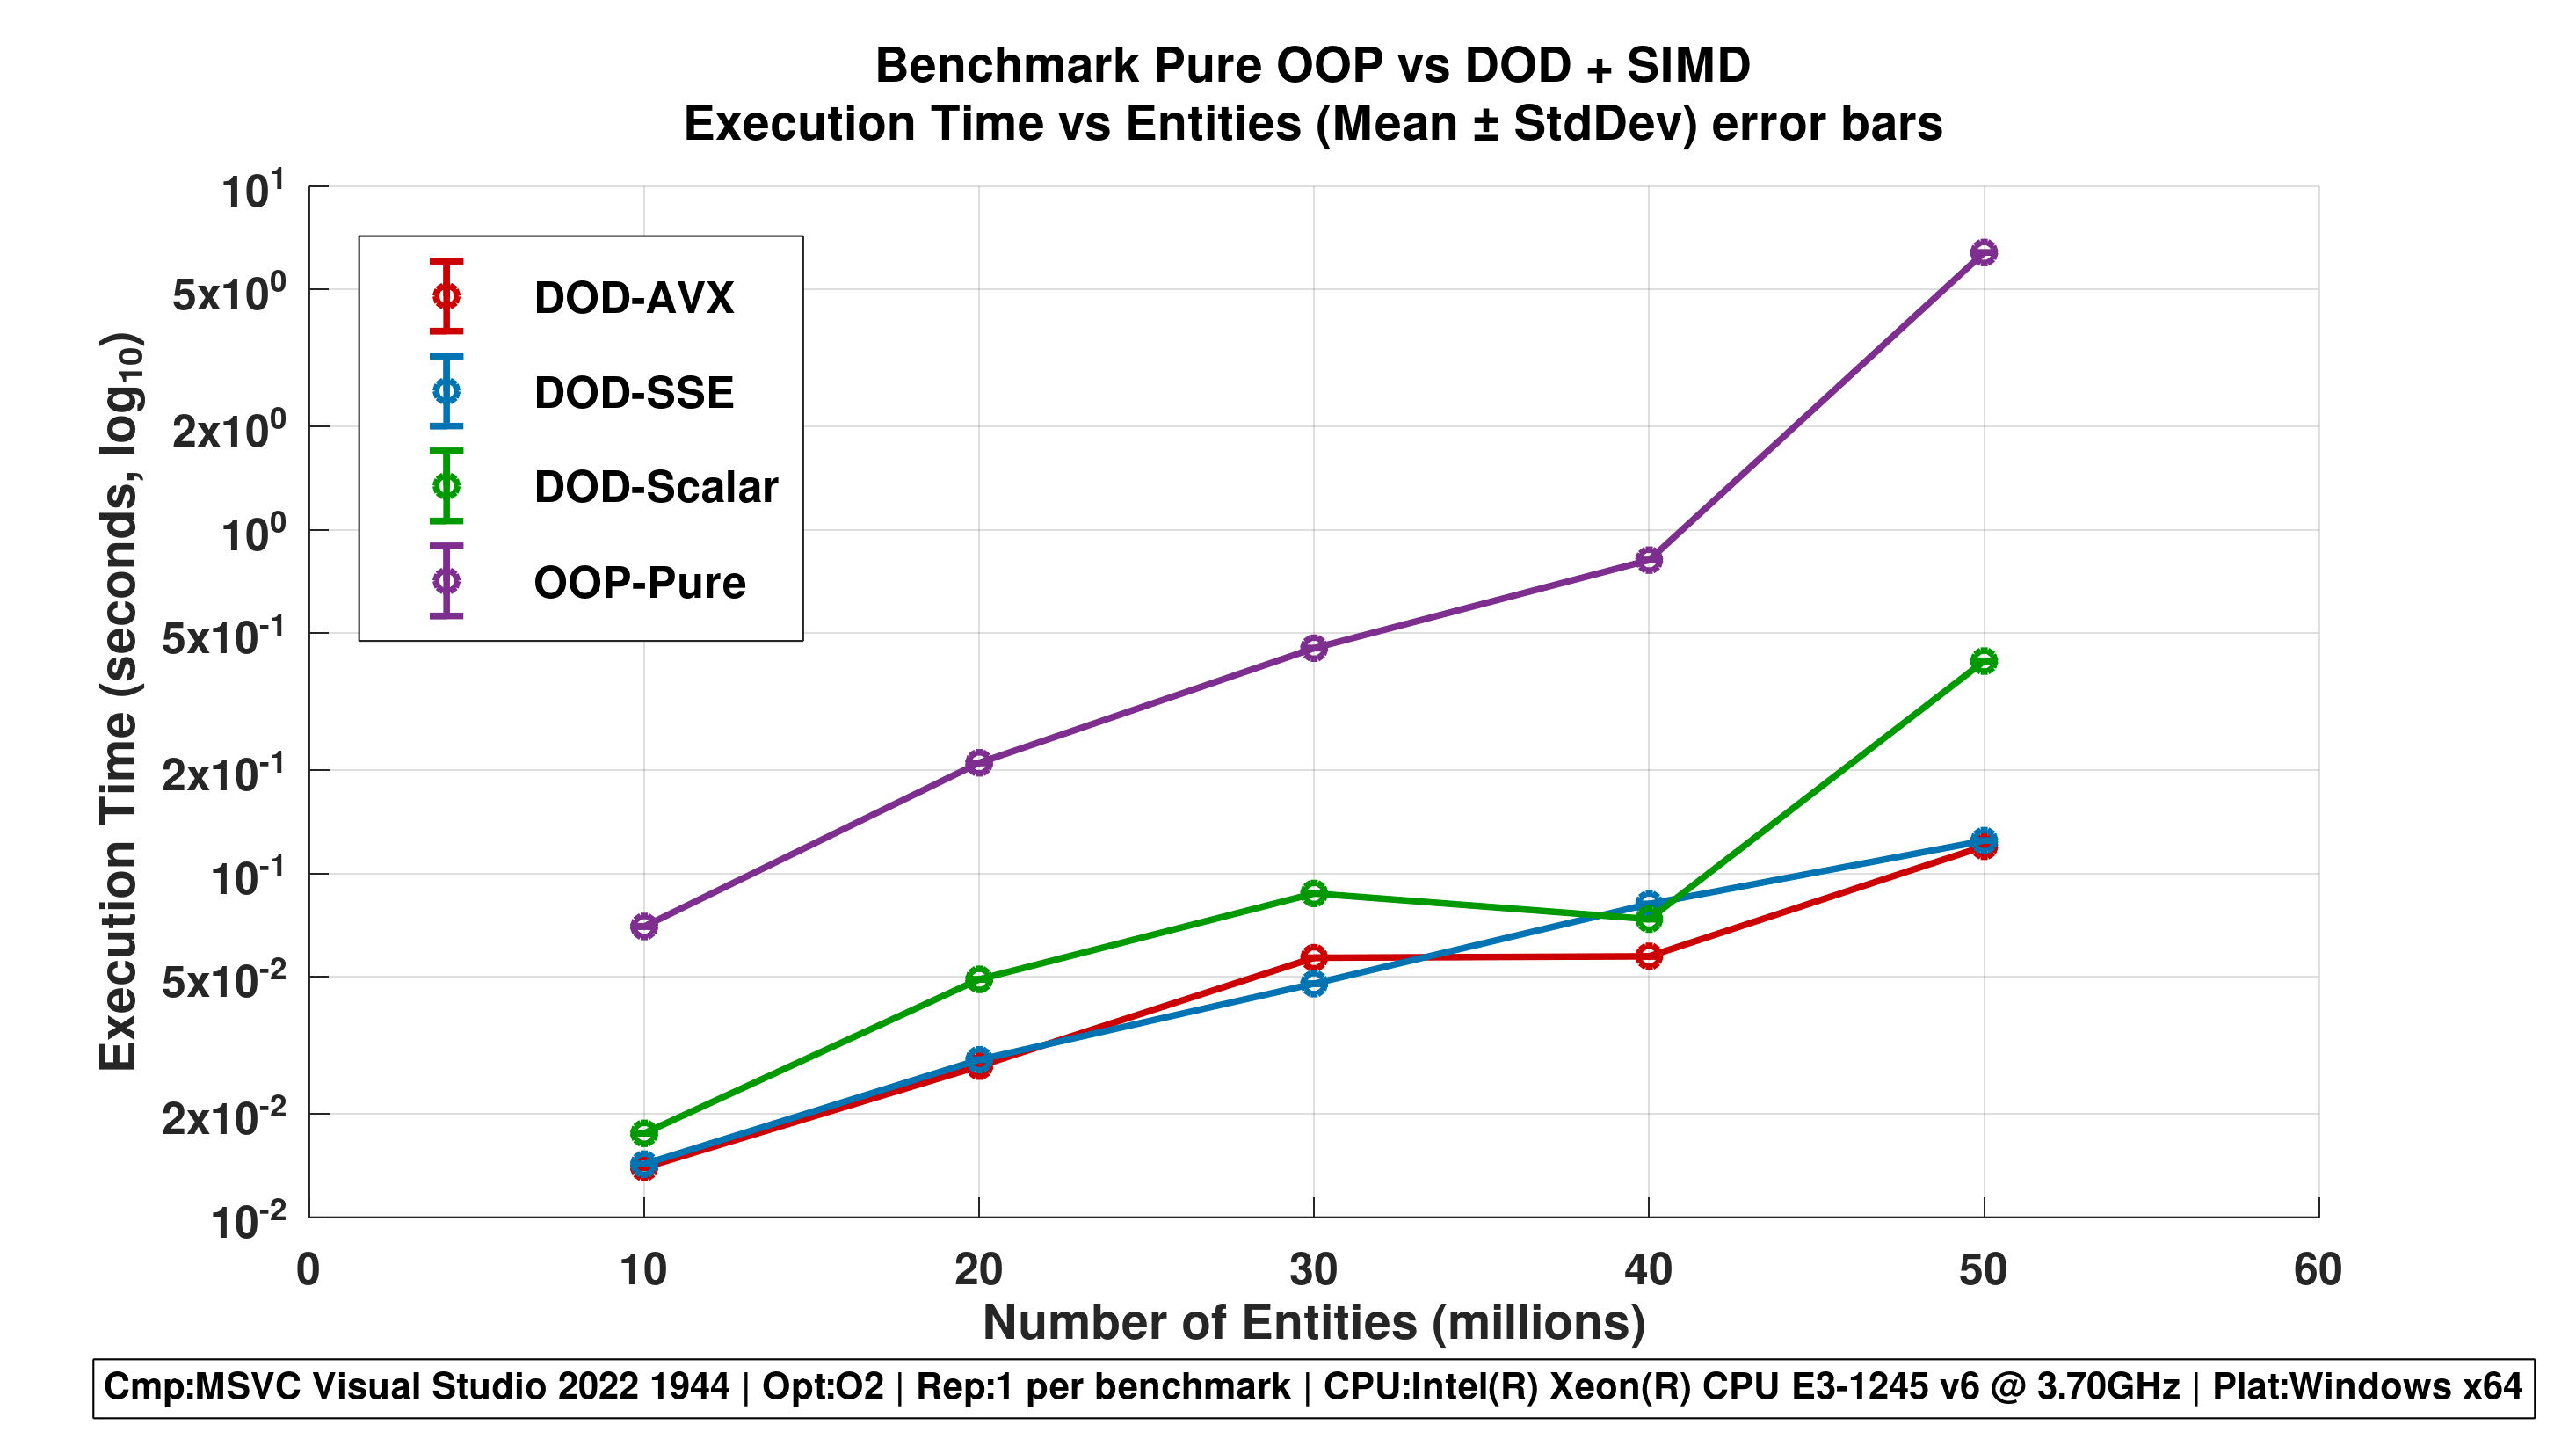
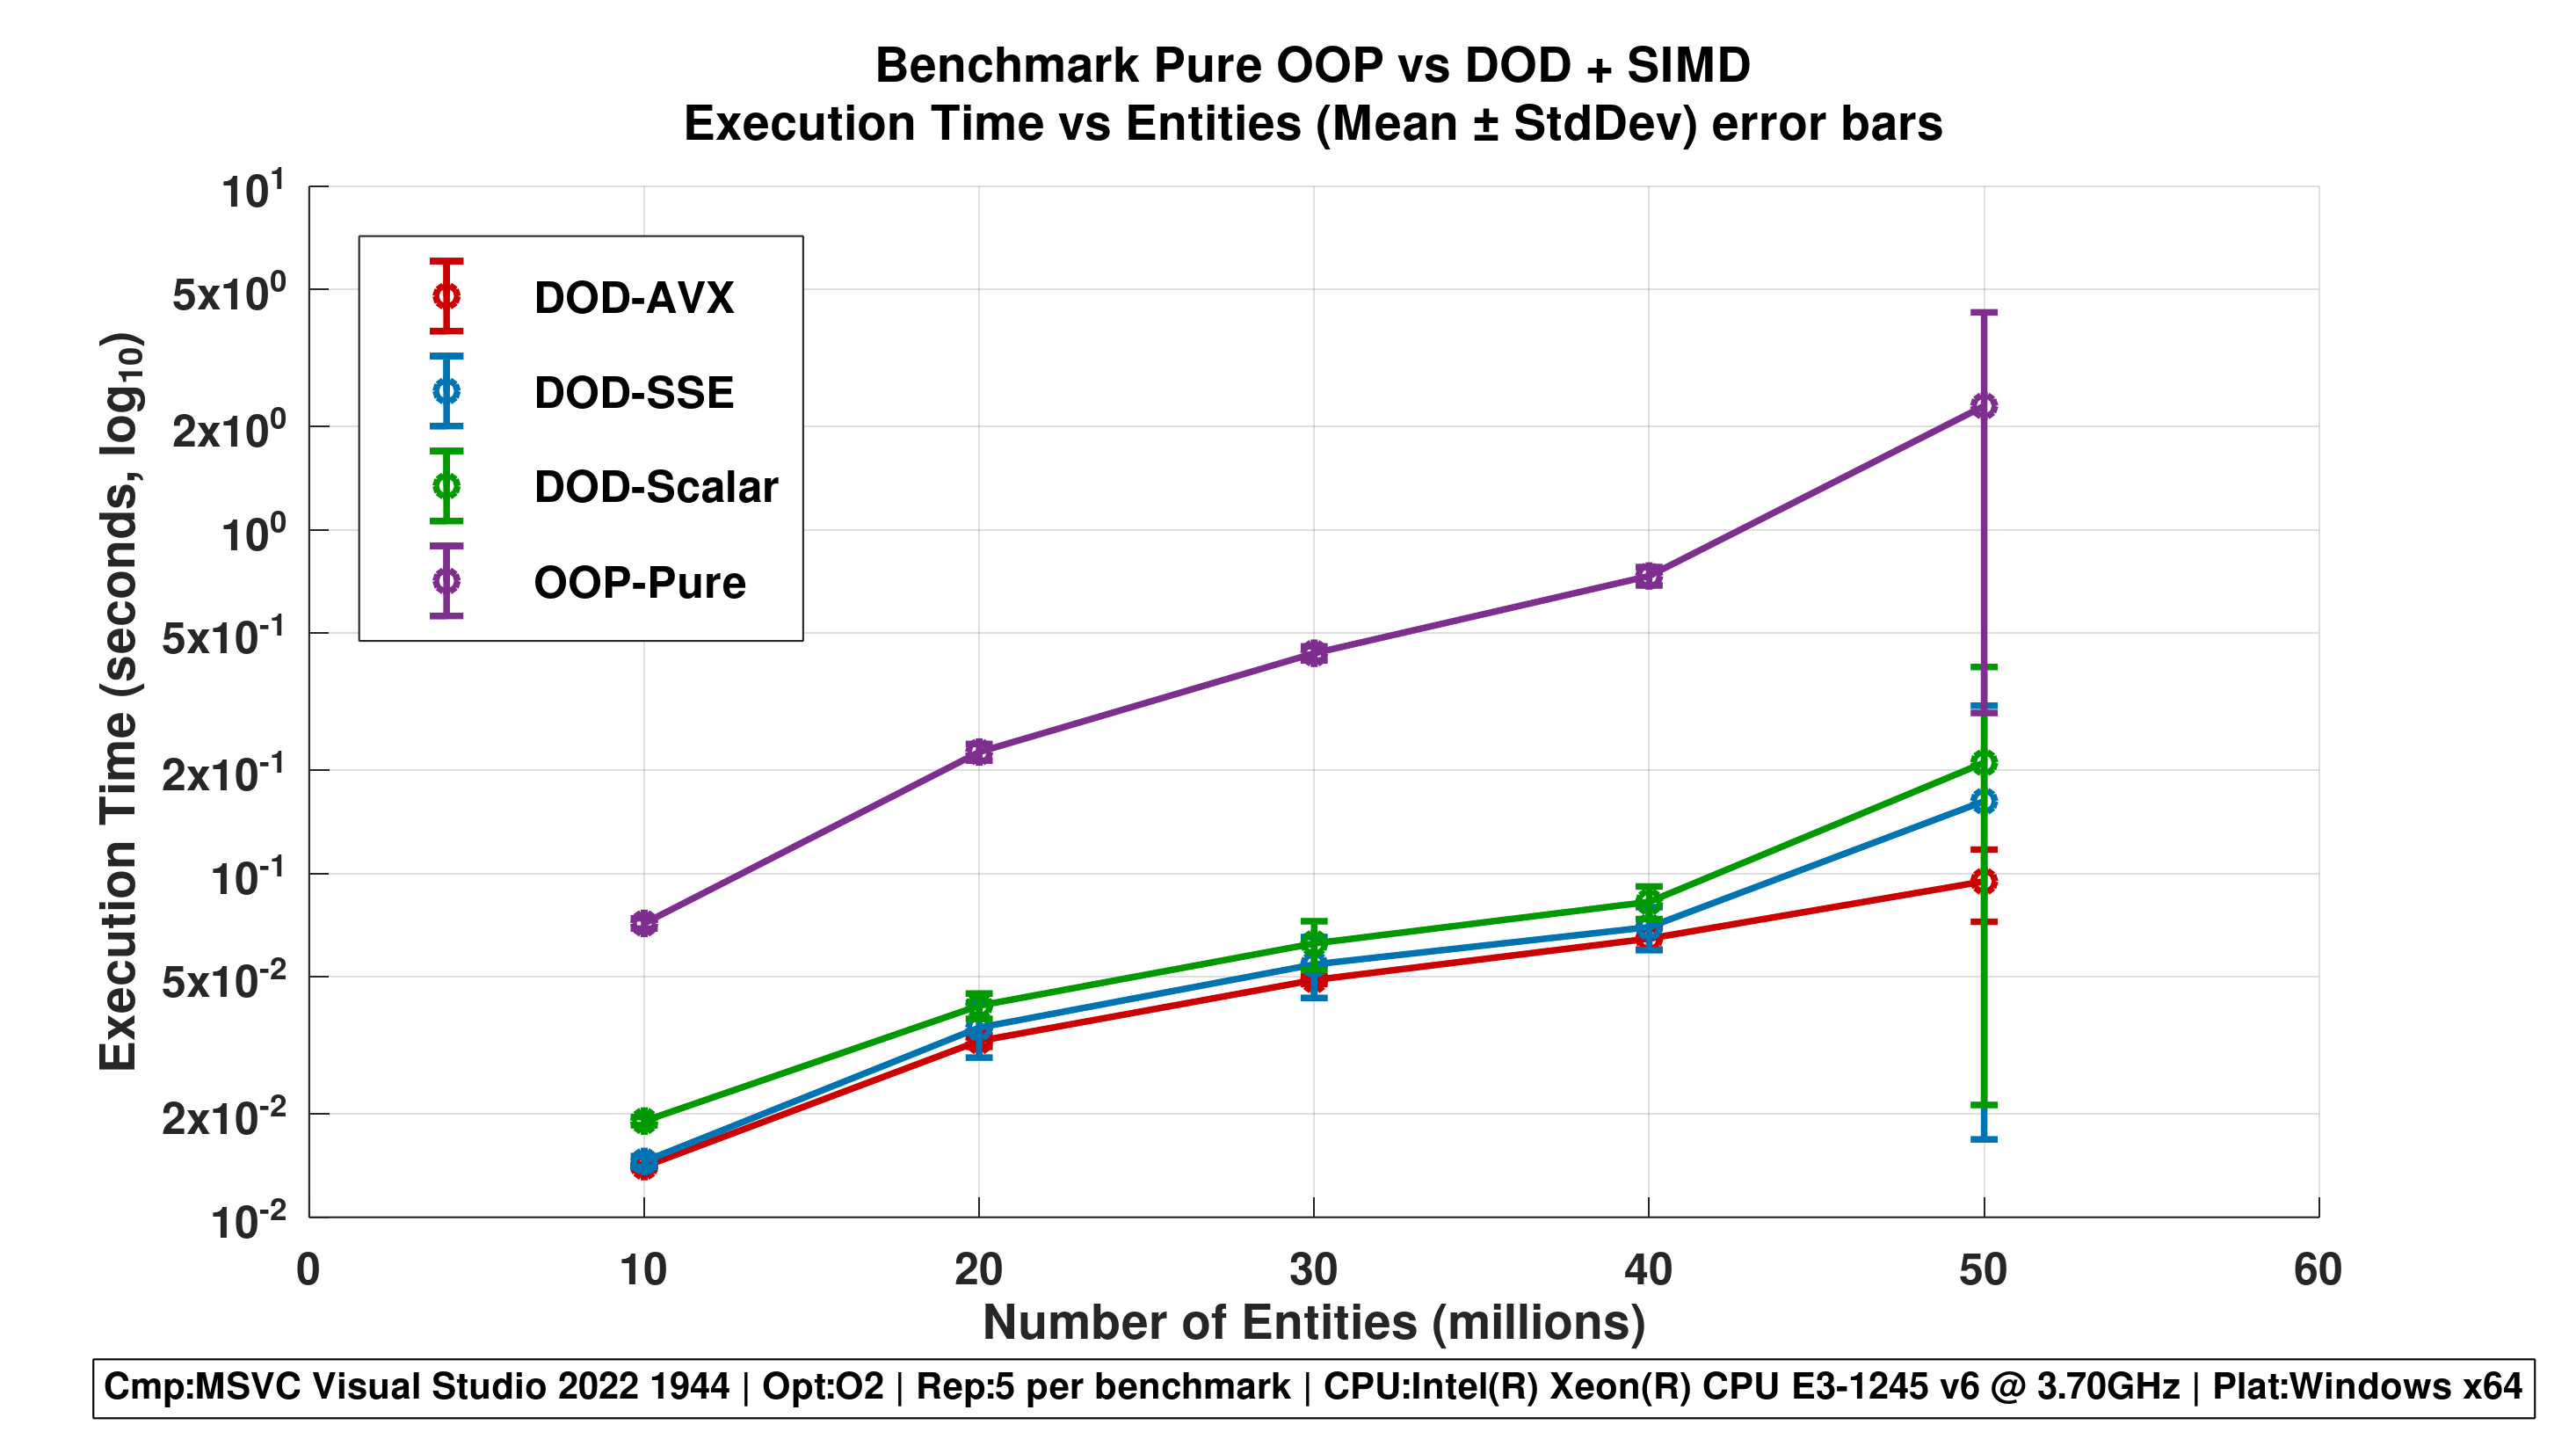
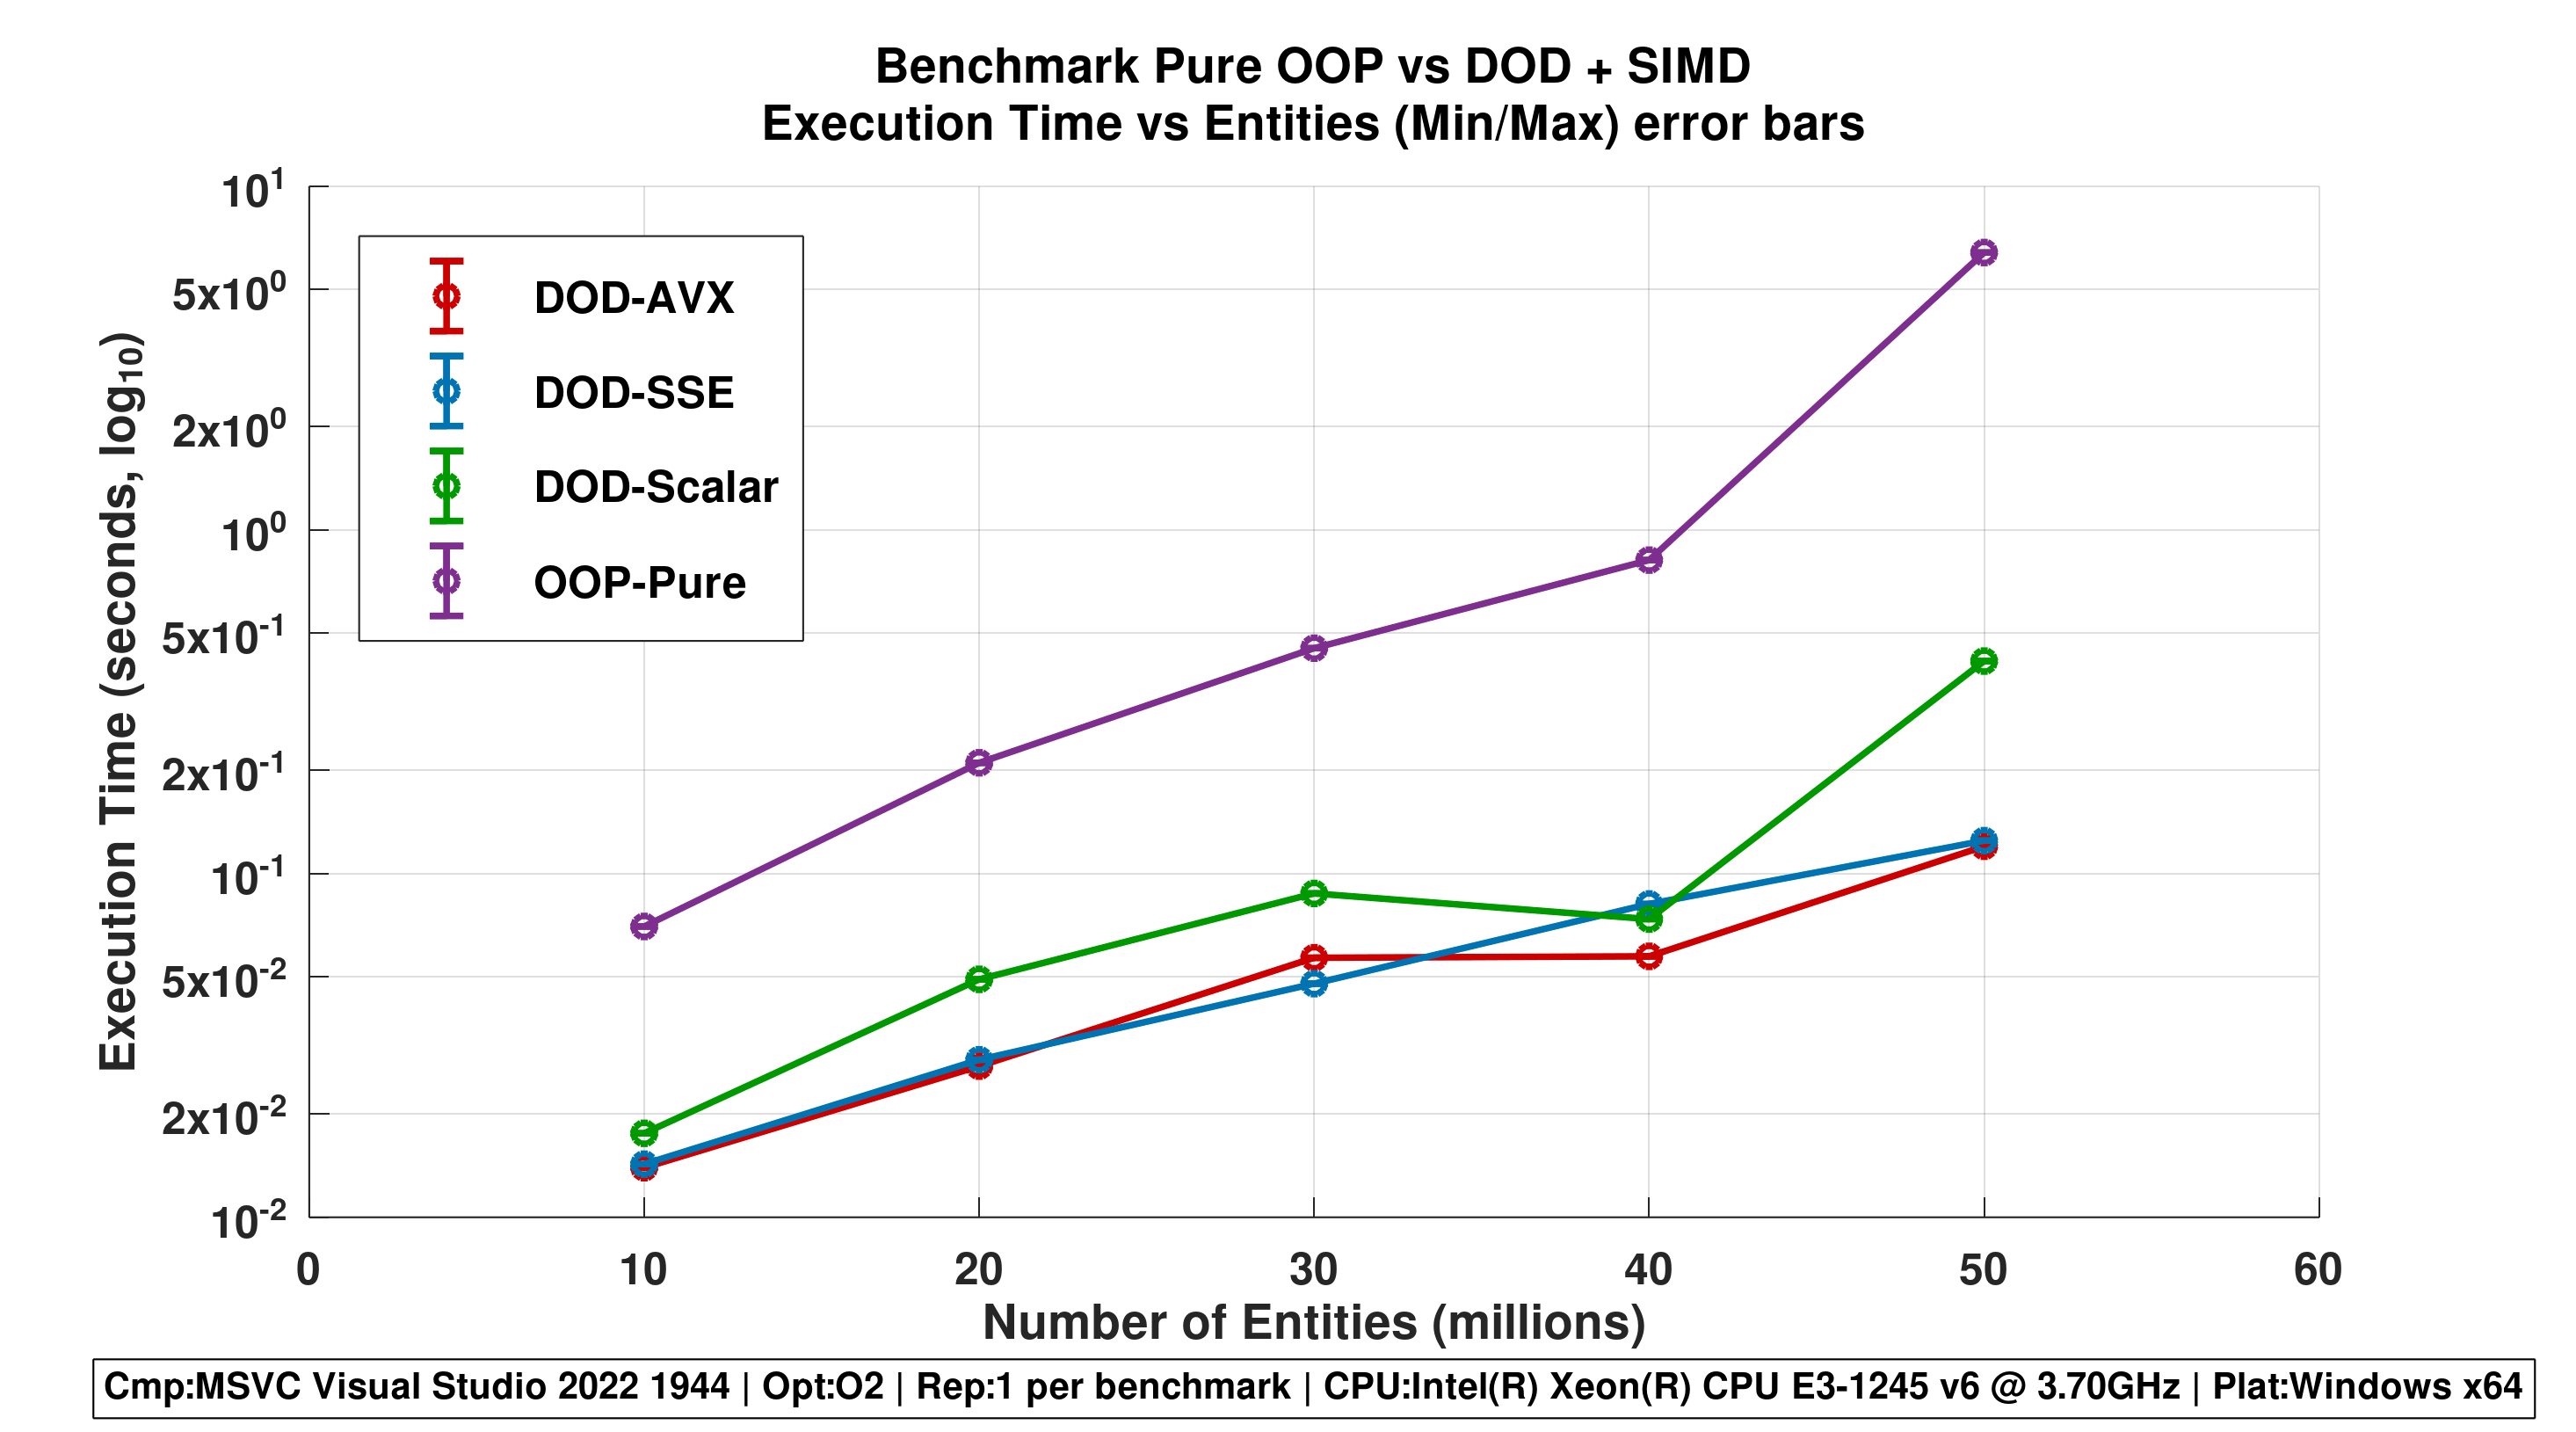
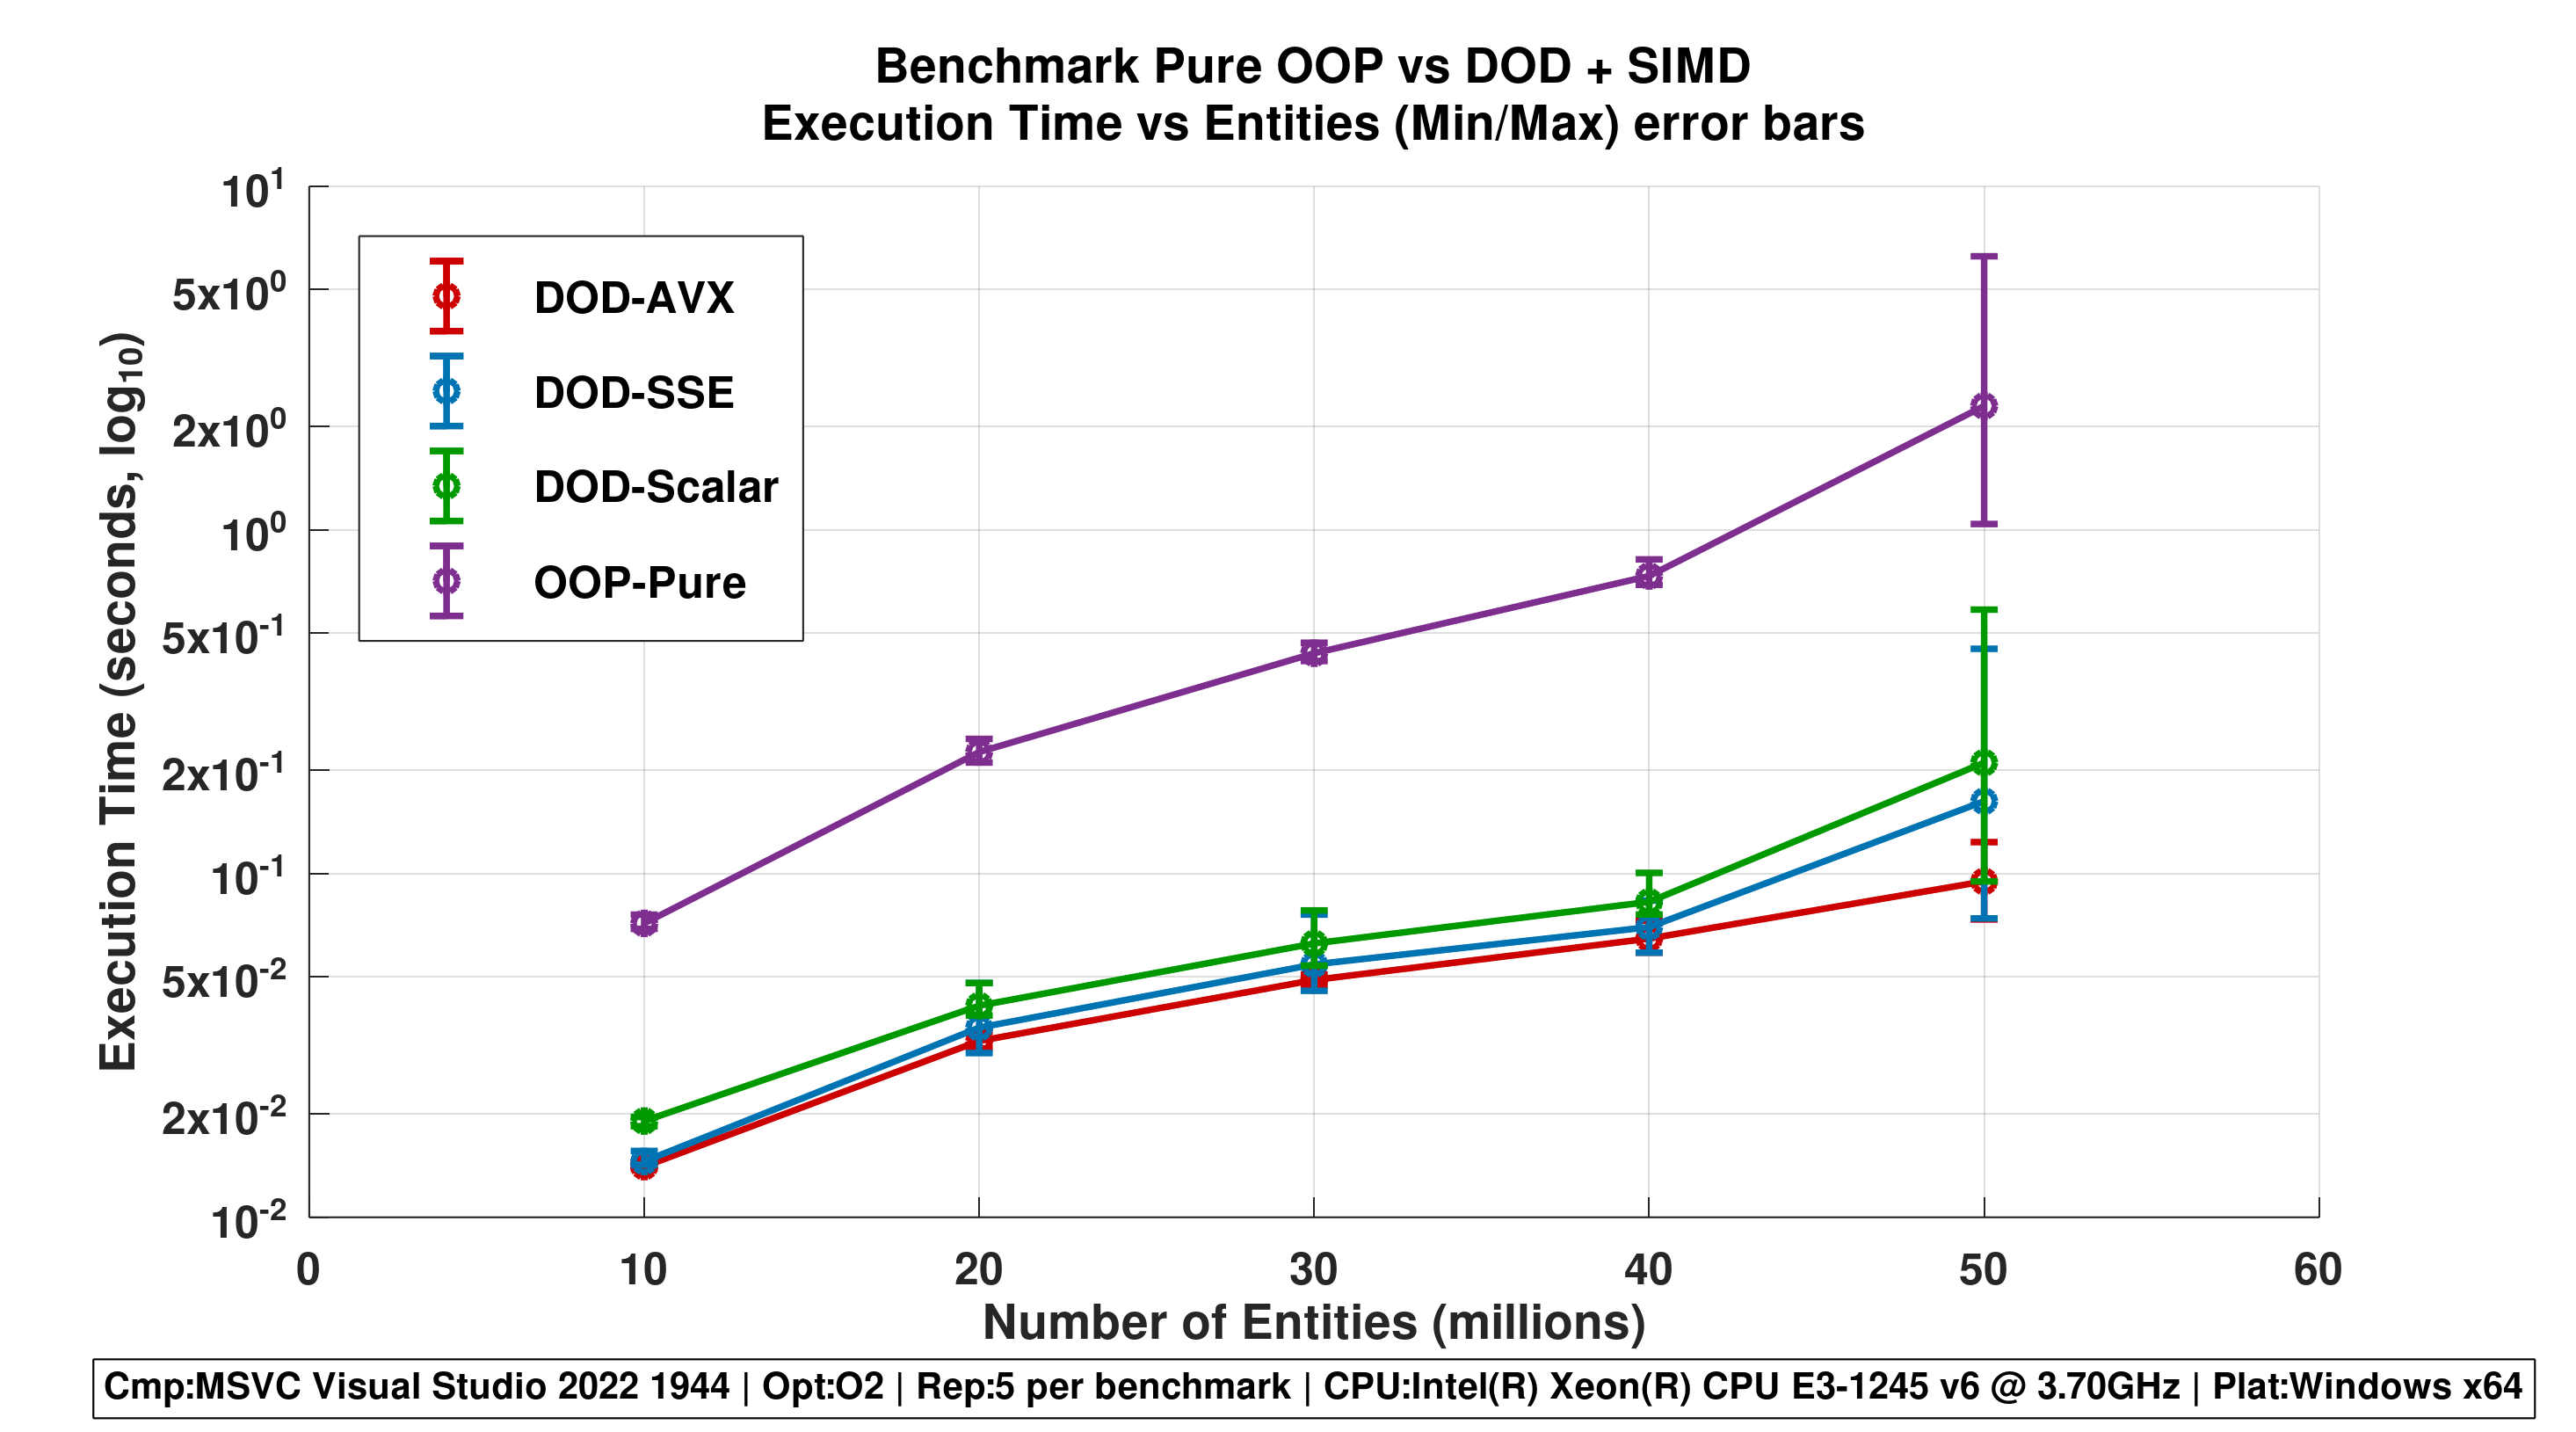
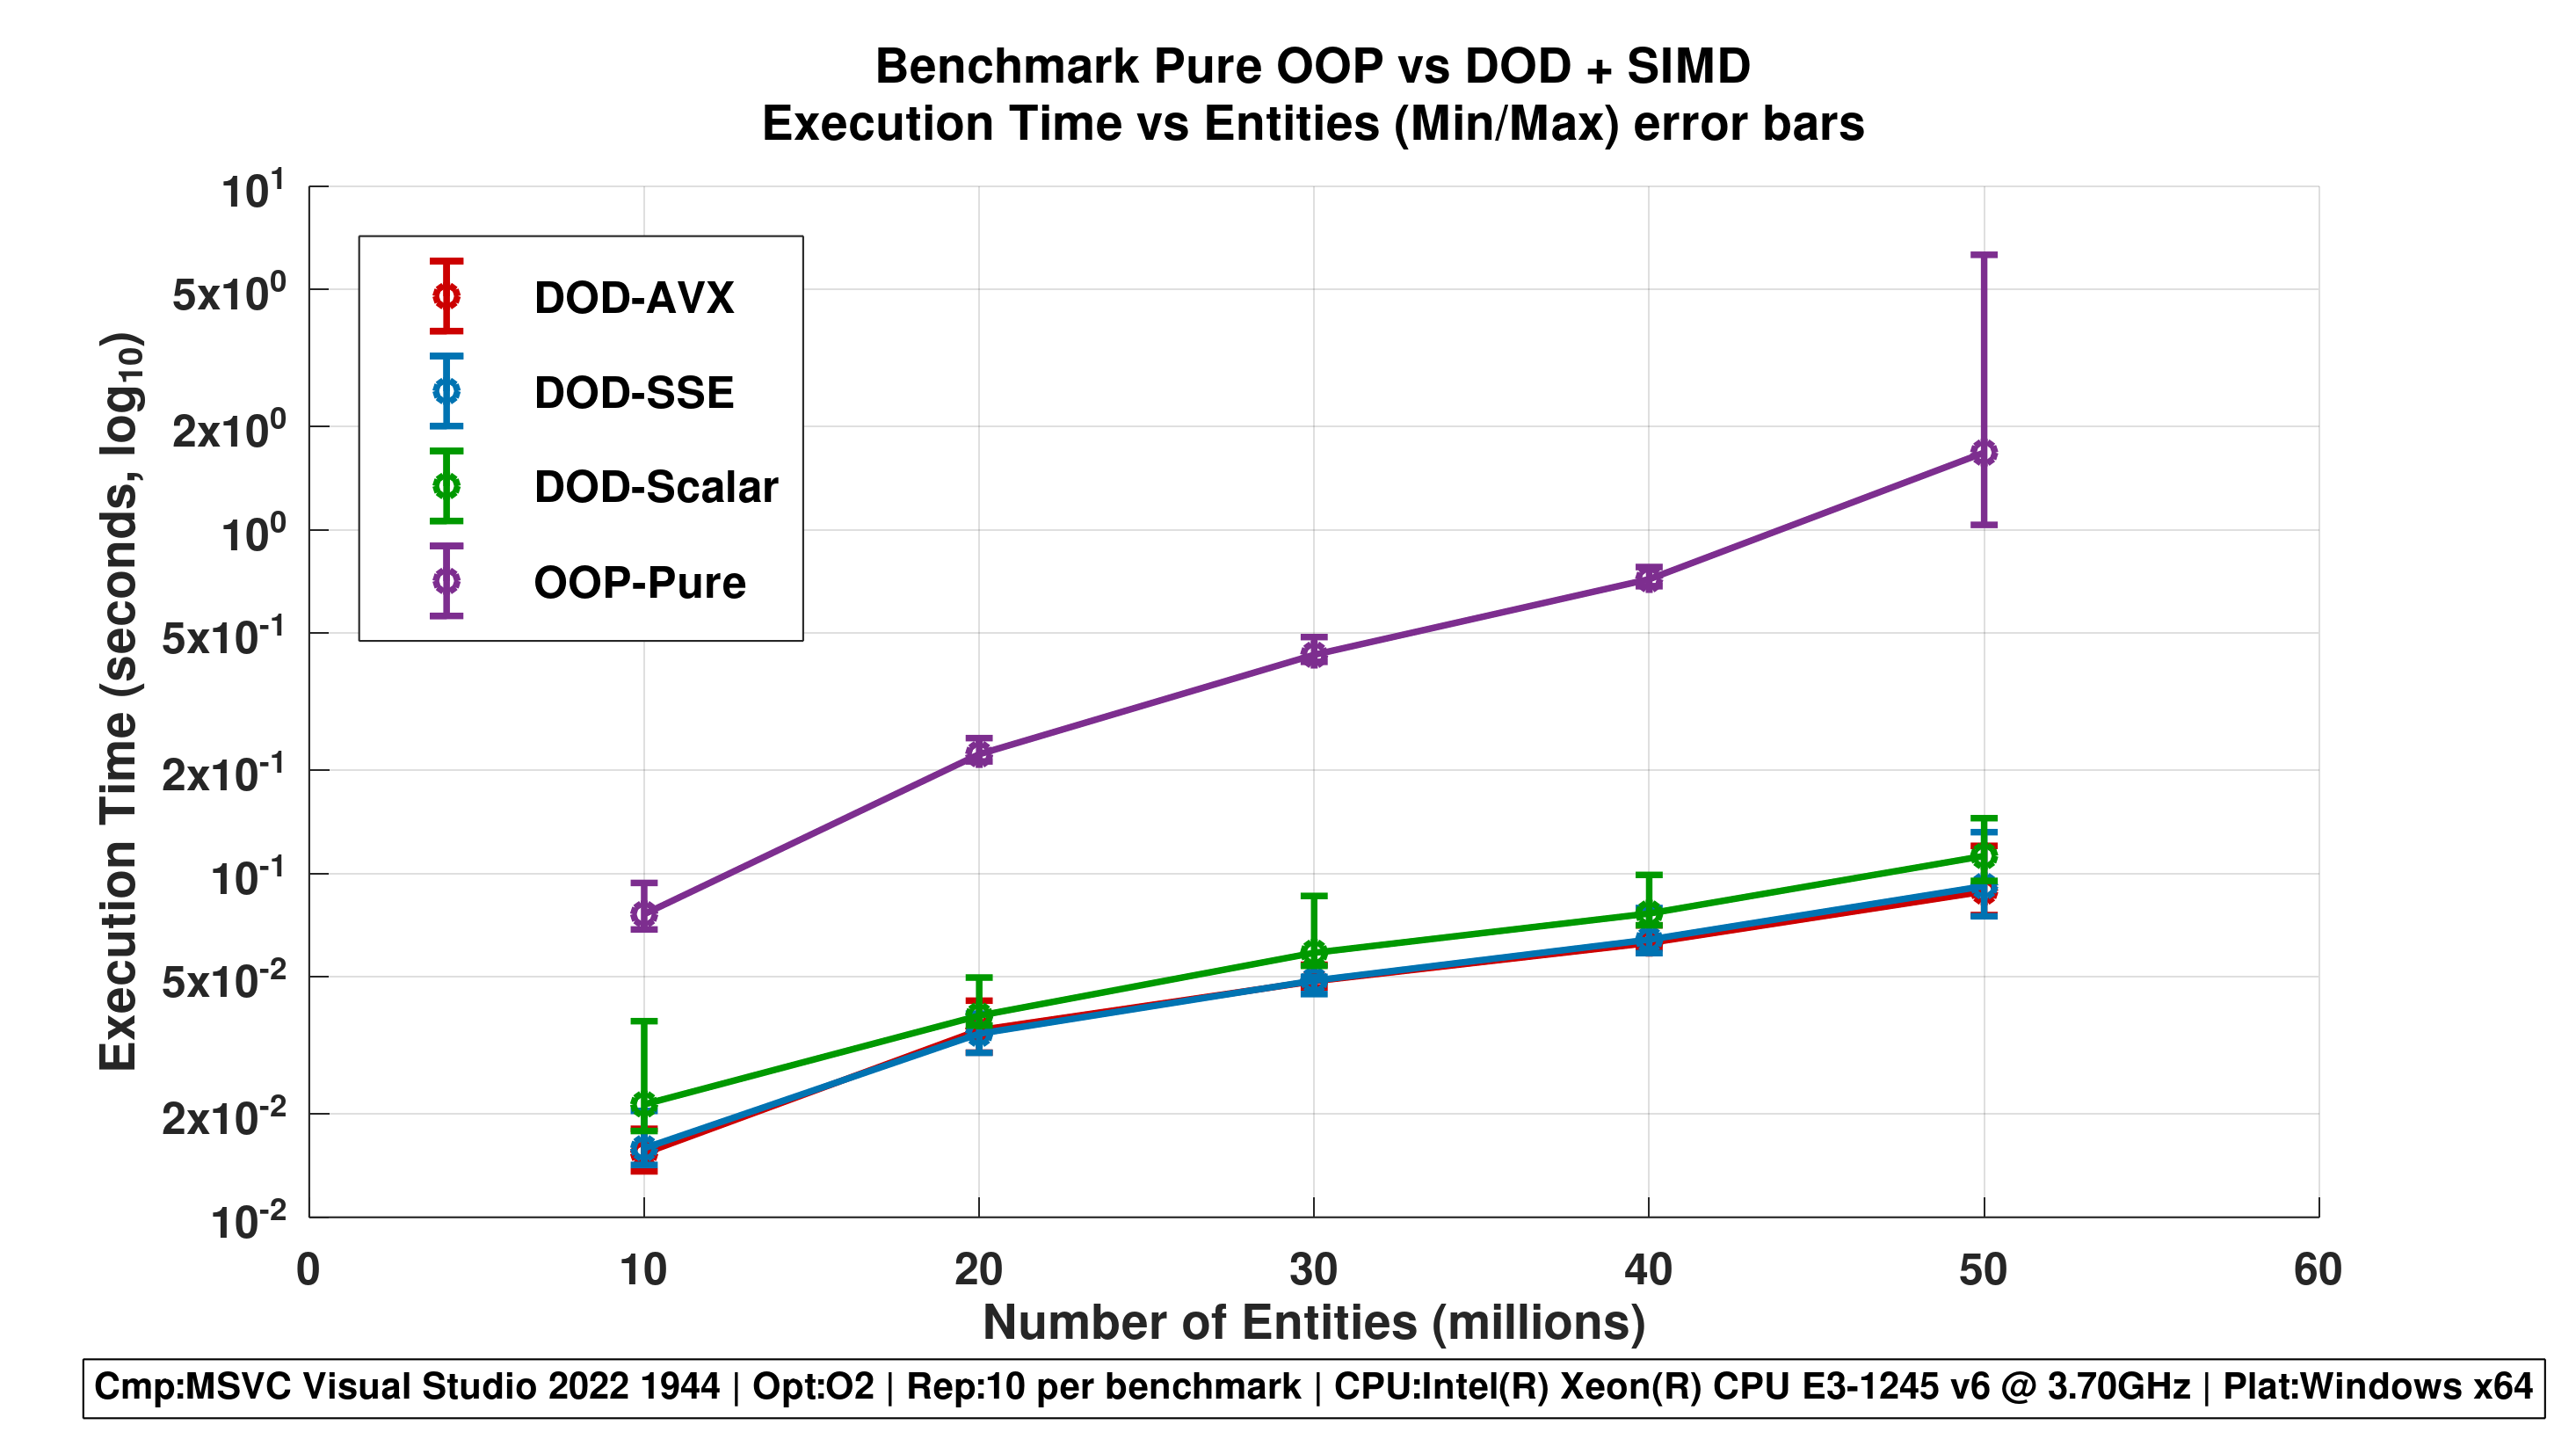
Figure 1 - Execution Time vs Entities (Mean ± StdDev)
- Error bars show stability across repetitions.
- Highlights scalability of DOD approaches and volatility of OOP-Pure.
Repetitions 1
Repetitions 5

Repetititons 10
-
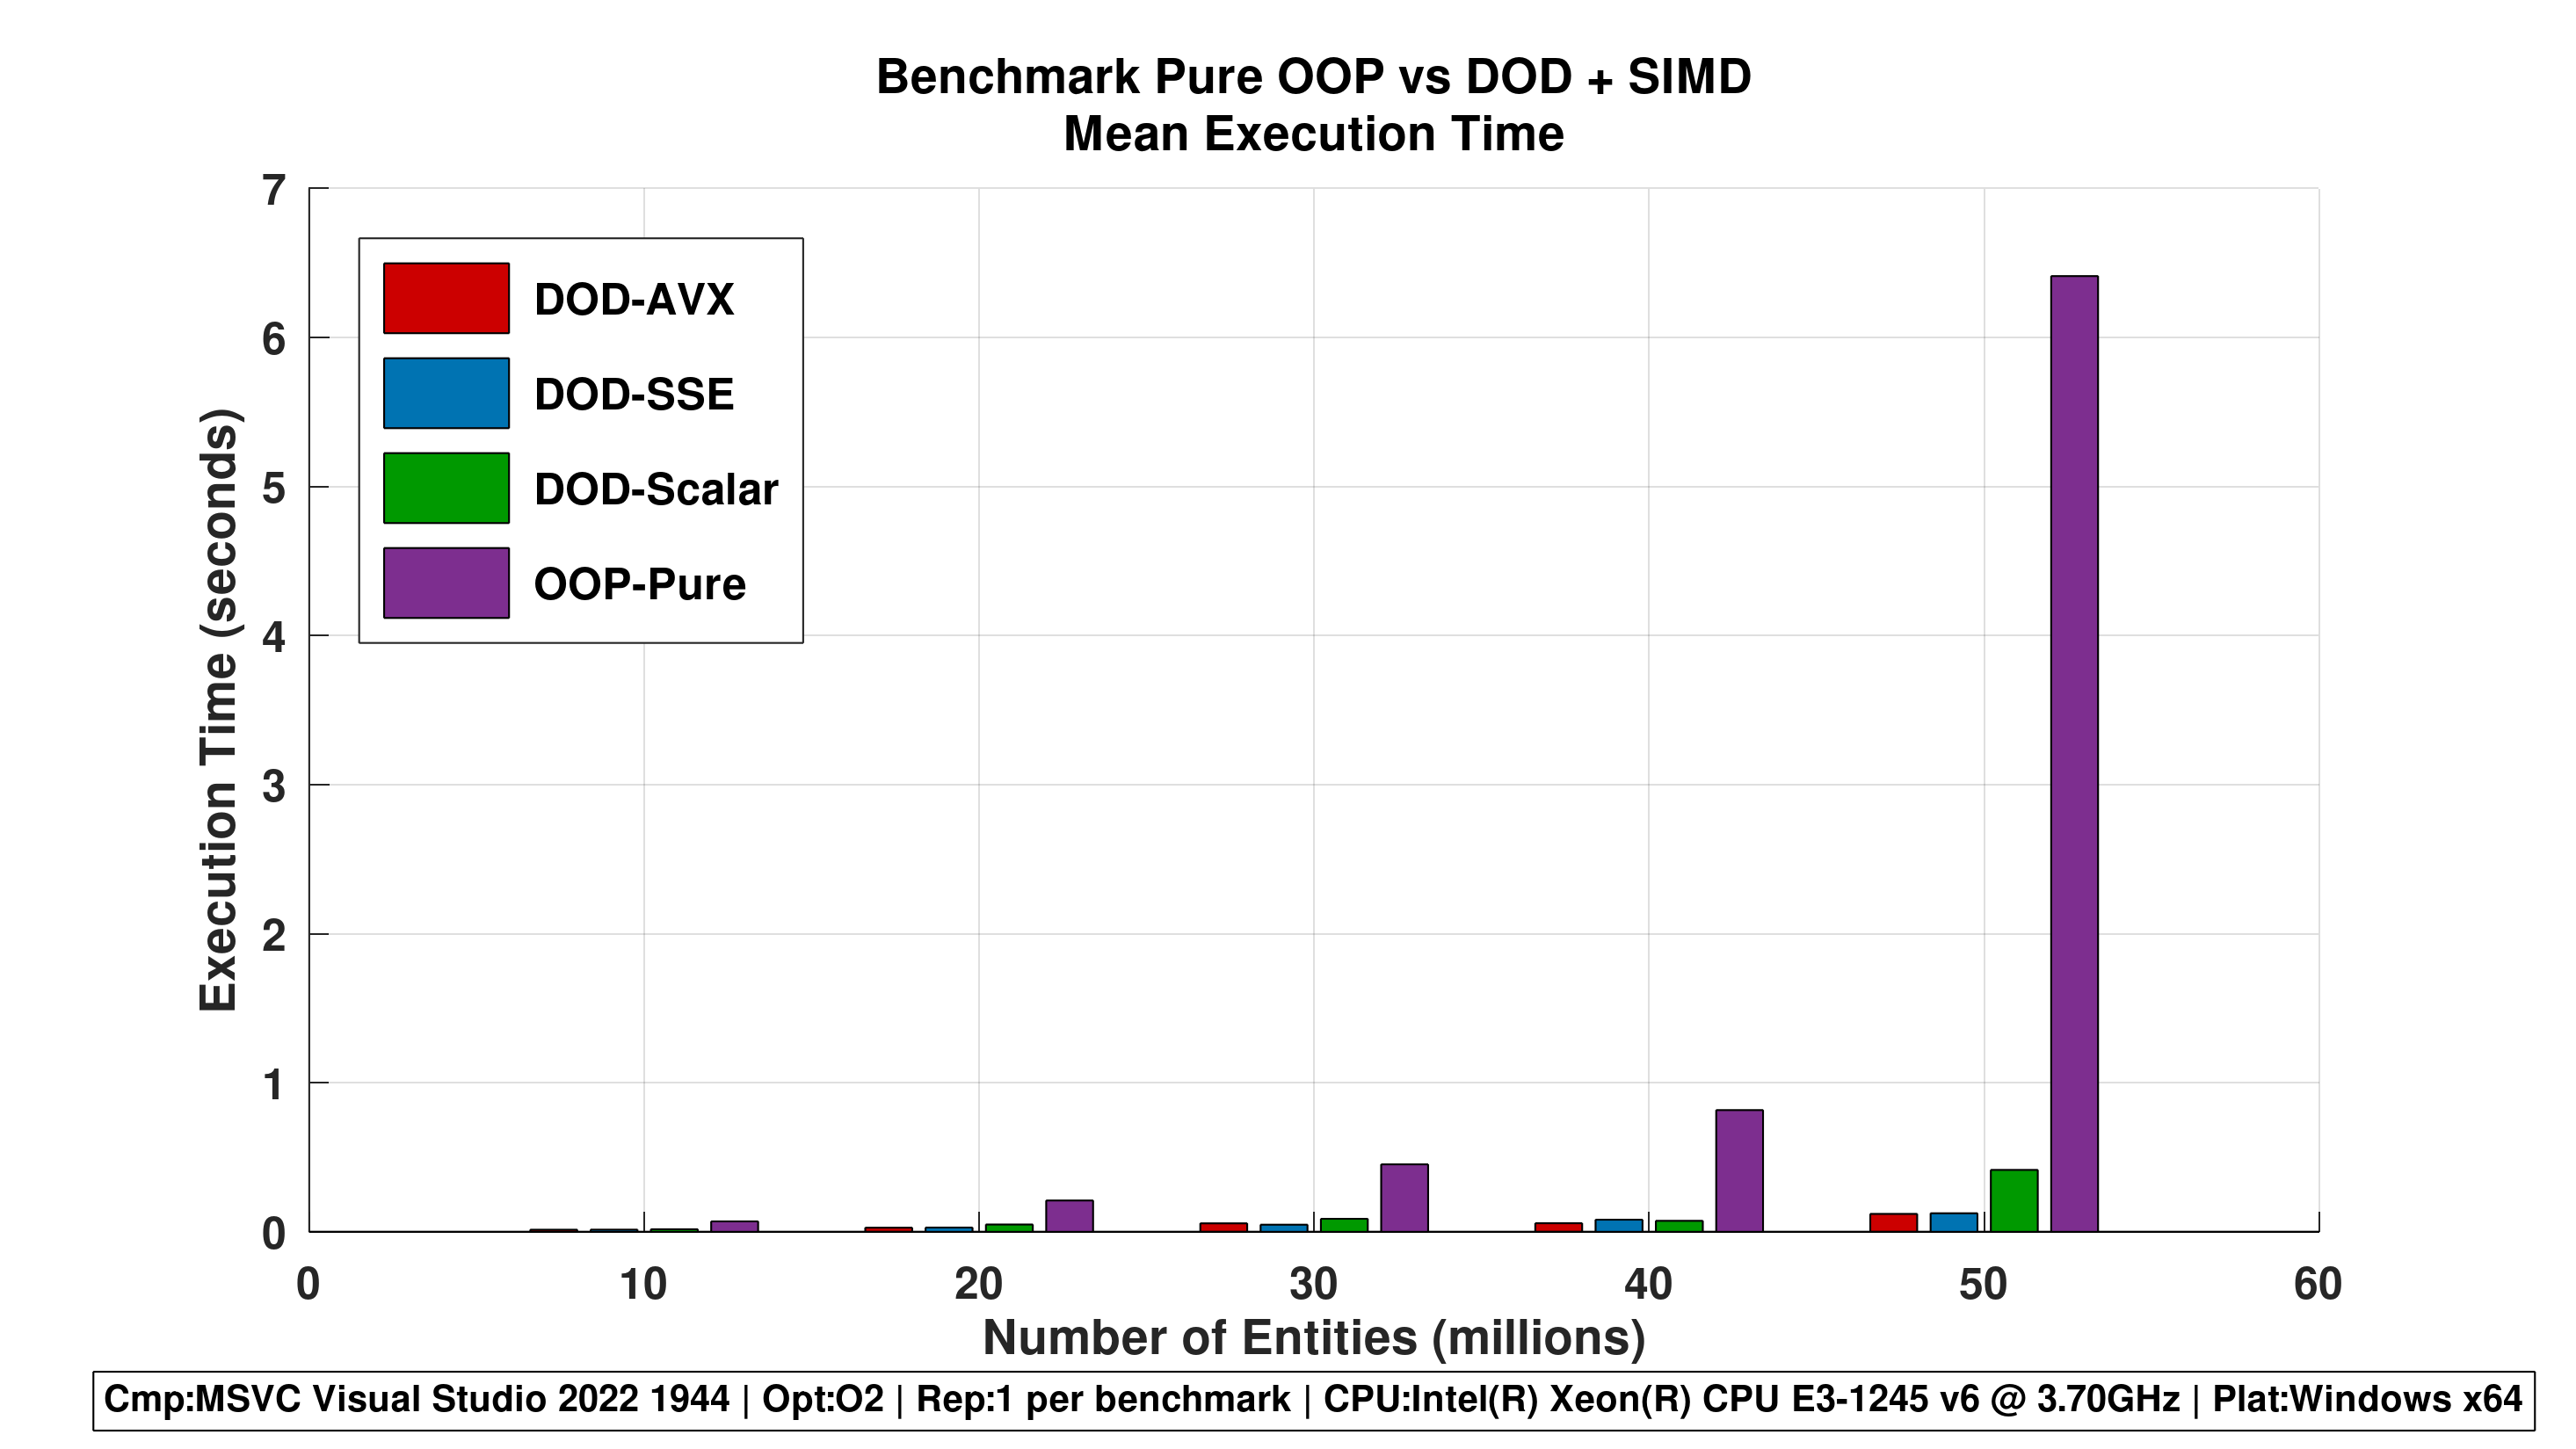
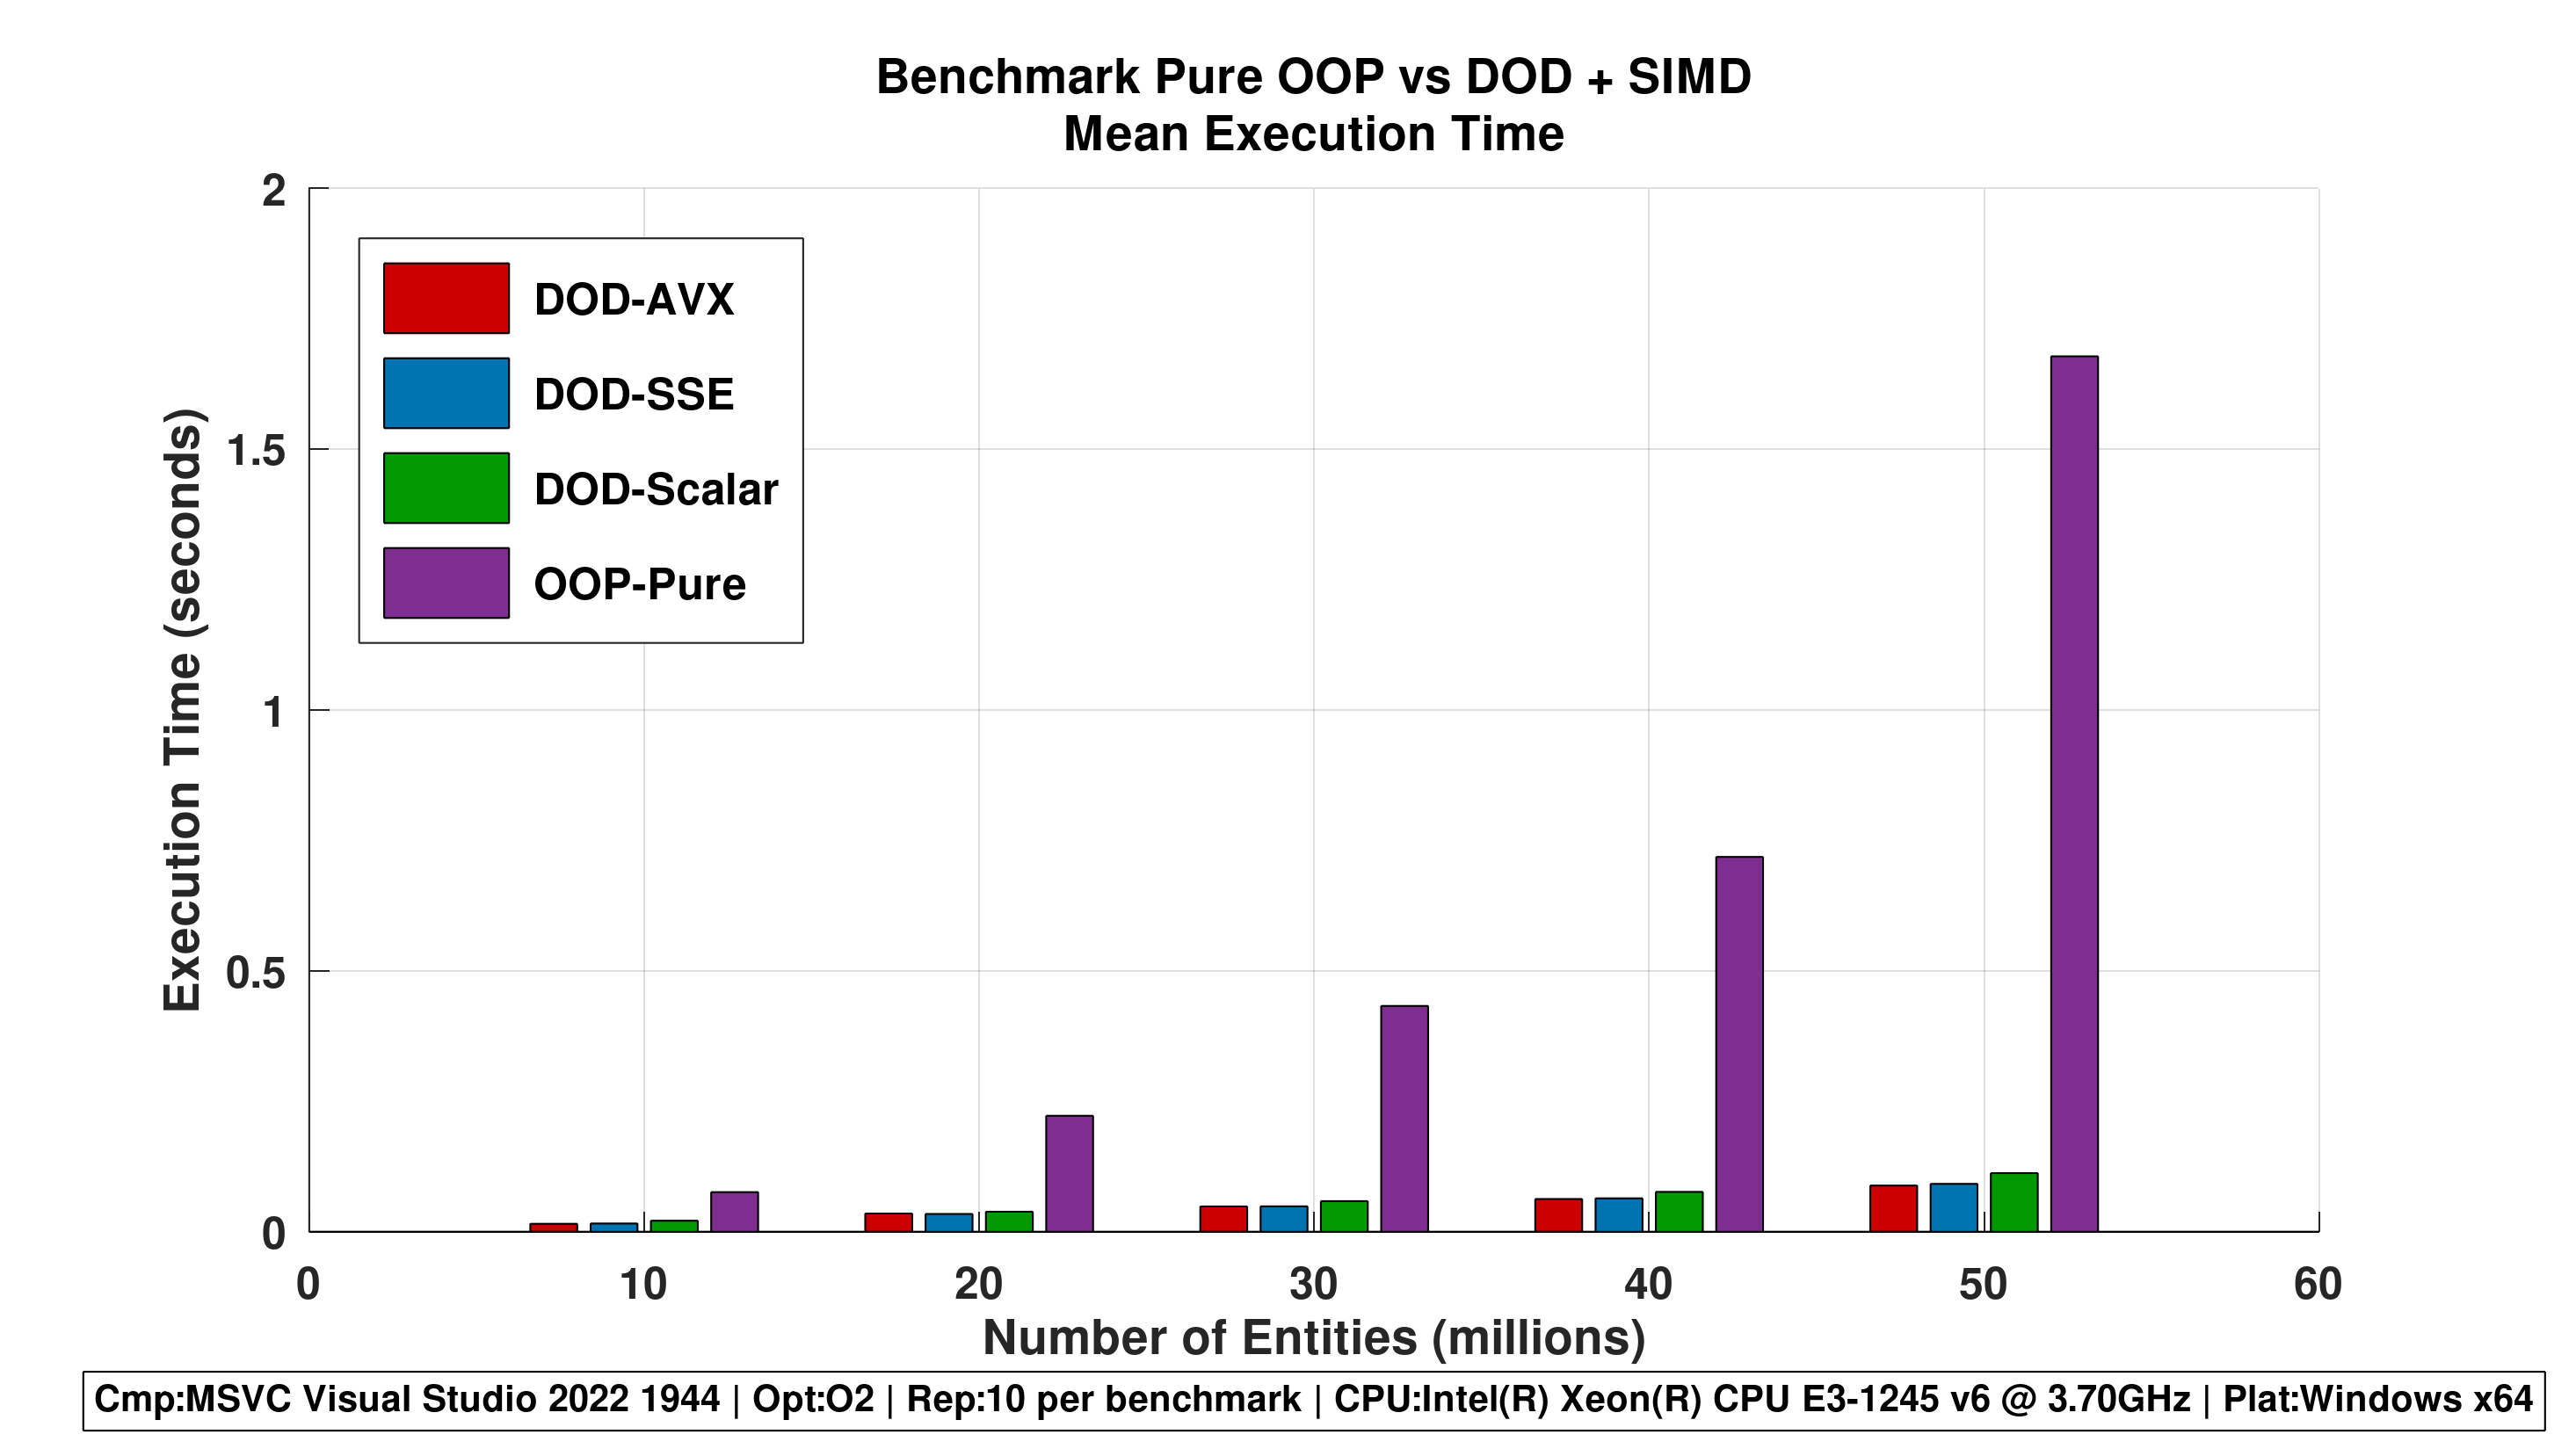
Figure 2 - Grouped Bar Chart (Mean Values)
- Direct comparison of mean execution times per entity count.
- Clearly shows the advantage of DOD over OOP and the incremental benefit of SIMD.
Repetitions 1
Repetitions 5
Repetititons 10
-
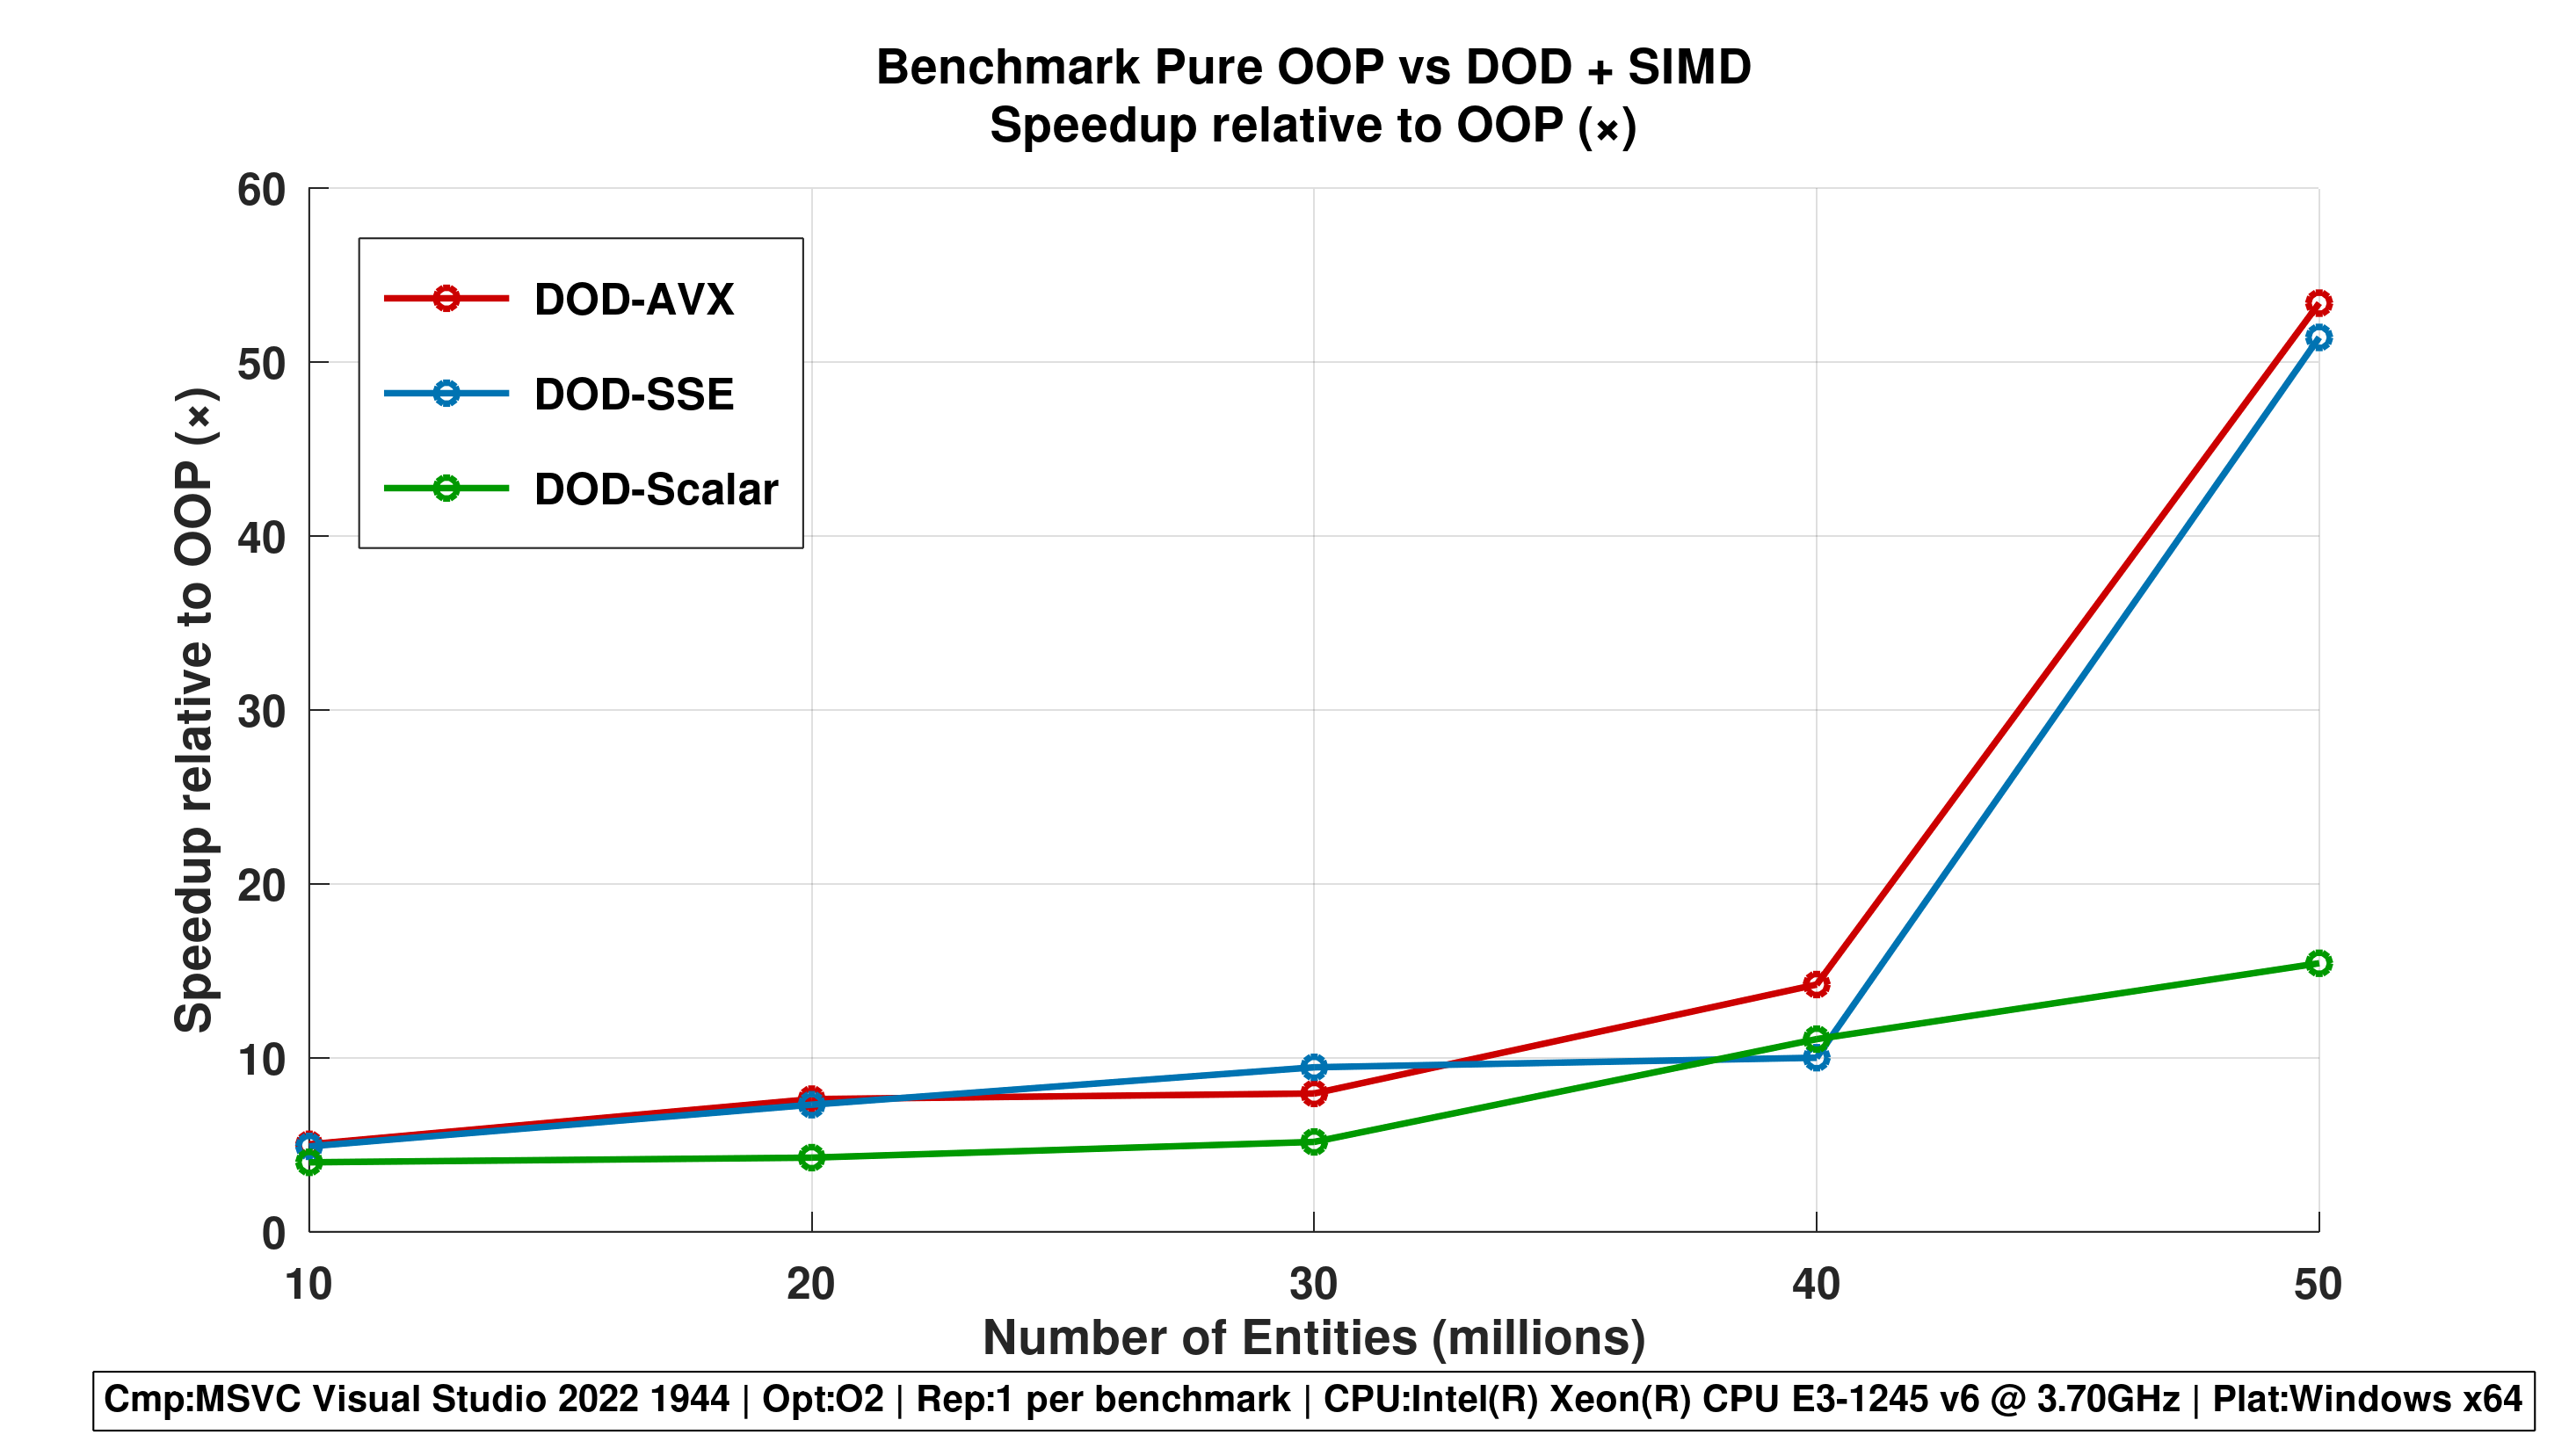
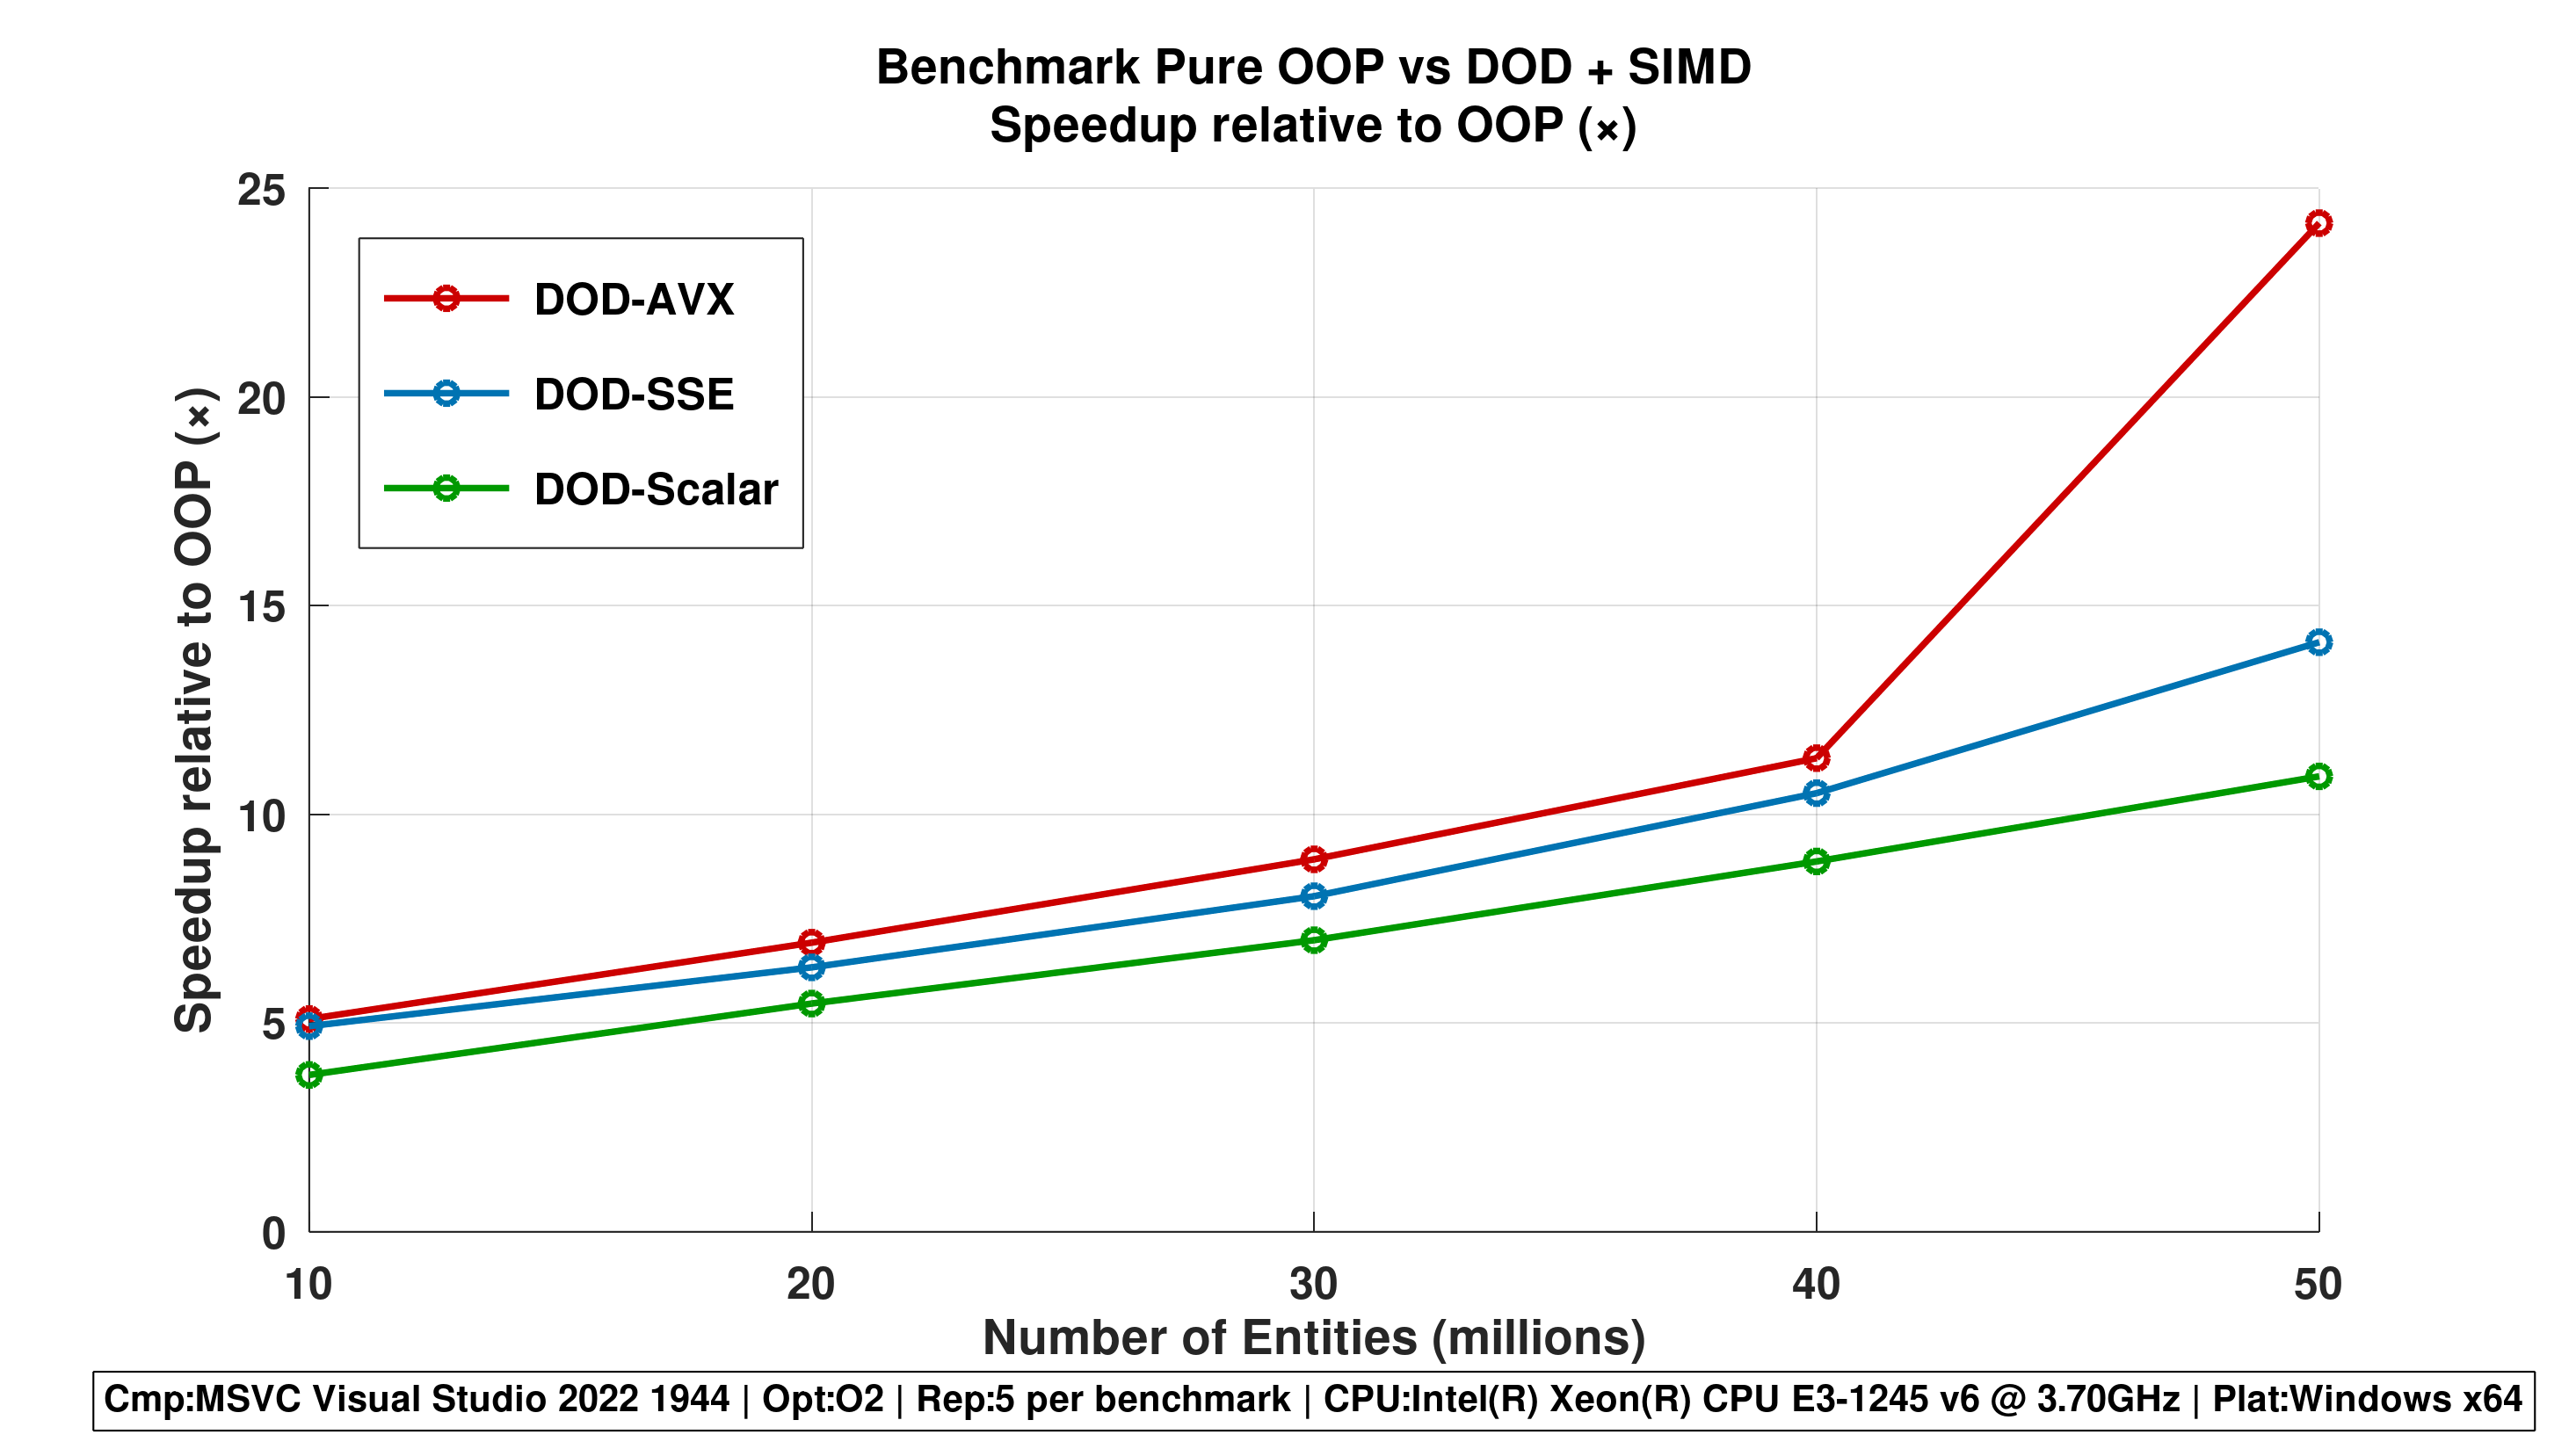
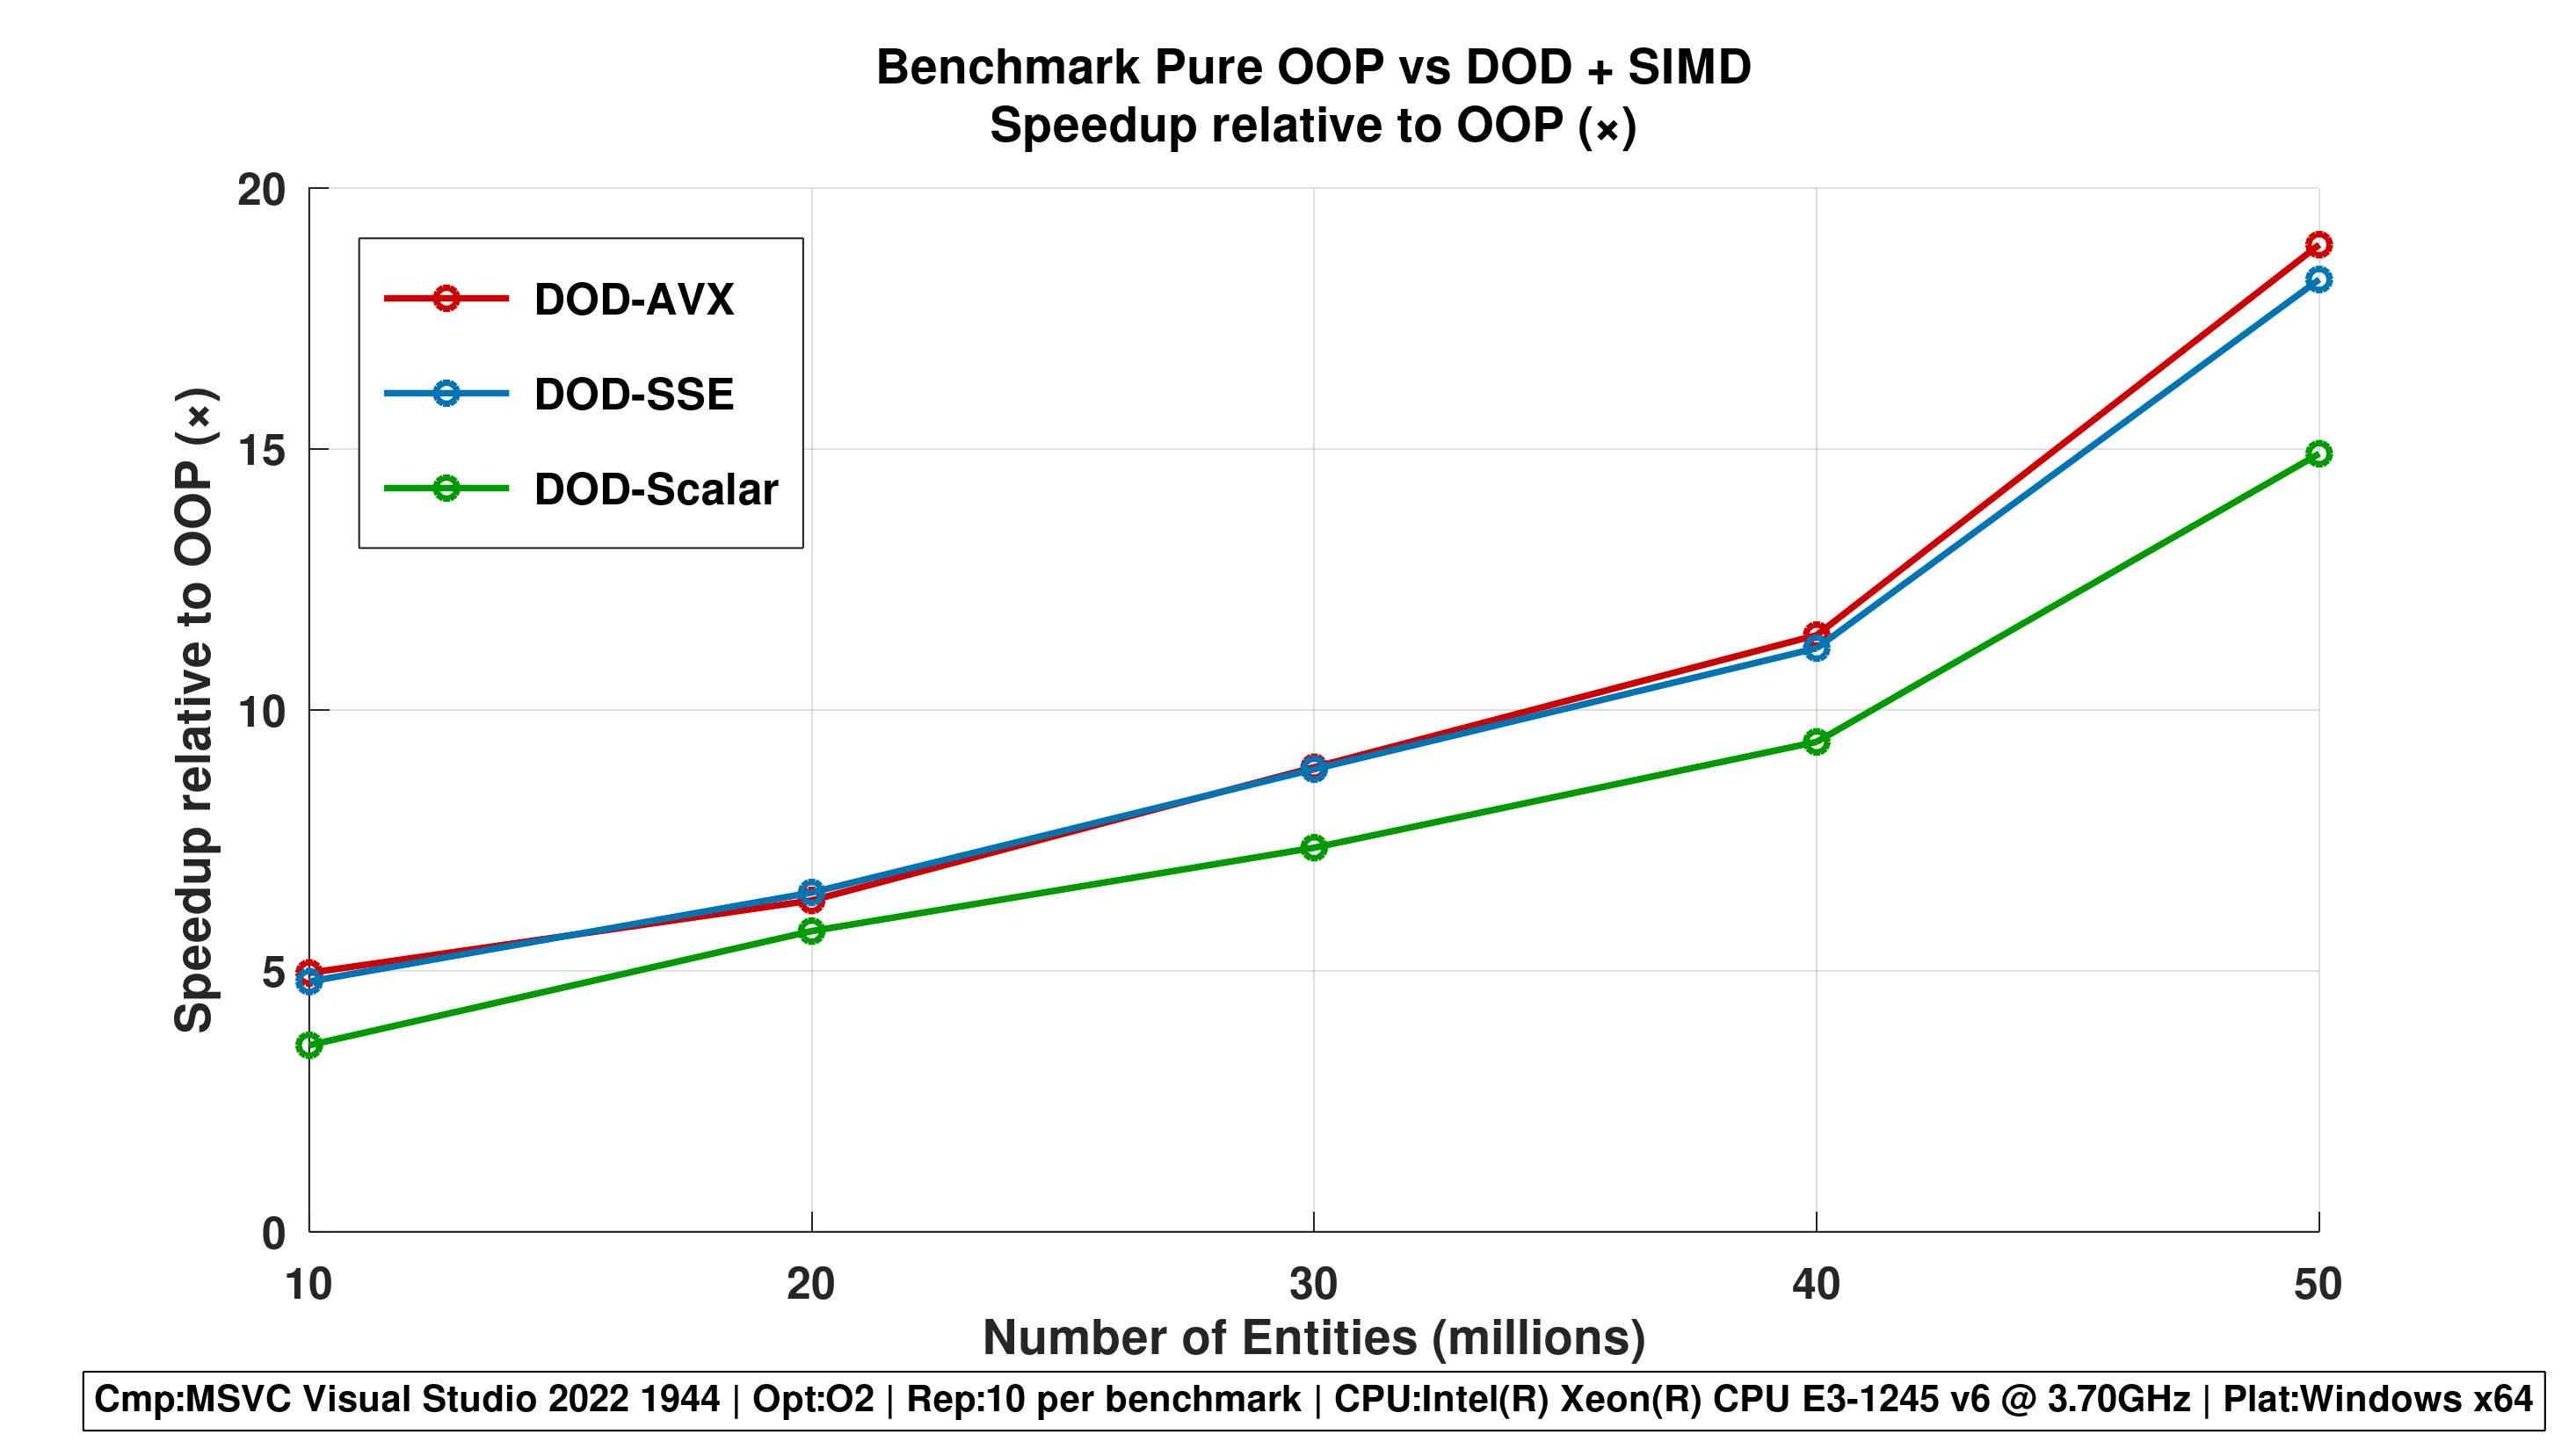
Figure 3 - Speedup Relative to OOP (×)
- All DOD-based approaches consistently outperform OOP-Pure.
- DOD-AVX achieves up to 50x speedup at 50M entities, demonstrating the dramatic impact of data-oriented design and SIMD.
Repetitions 1
Repetitions 5
Repetititons 10
-
Figure 4 - Line Plot with Min/Max Error Bars
- Shows execution time ranges across repetitions.
- Emphasizes stability differences: DOD-AVX lines are tightly clustered; OOP-Pure has wide fluctuation.
Conclusions
This benchmark study highlights several clear insights:
- Data-Oriented Design (DOD) dramatically improves performance over traditional OOP approaches.
- SIMD acceleration (SSE/AVX) further enhances throughput, especially for large workloads.
- Stability is critical: DOD-AVX not only runs faster but also produces more predictable execution times.
- Repetition analysis confirms that these performance trends are consistent across multiple runs, reinforcing the reliability of the DOD + SIMD approach.
Overall, for high-performance entity updates in CPU-bound applications, DOD combined with SIMD (AVX) provides the best combination of speed, scalability, and stability, making it the preferred choice over traditional OOP implementations.
Authored by: > Xavier Figuera - 2025 > LinkedIn