DOD vs OOP ECS Benchmark Results – SIMD Performance Analysis 5 repetitions
Created:
Sat 10 January 2026written by Xavier Figuera
Last modification:
Sat 10 January 2026System & Benchmark Setup
# Run Timestamp: 2025-12-25 12:09:46
# ================== CPU INFO ====================
# Architecture       : x86_64
# Manufacturer       : GenuineIntel
# Model              : Intel(R) Xeon(R) CPU E3-1245 v6 @ 3.70GHz
# Logical Threads    : 8
# Physical Cores     : 4
# ================================================
# Compiler: MSVC Visual Studio 2022 1944
# Platform: Windows x64
# Optimization: O2
# Repetitions 5 per benchmark
# ================================================
Benchmark Results
The following tables present a summary of the benchmark results comparing different approaches (OOP-Pure, DOD-Scalar, DOD-SSE, DOD-AVX) for updating a large number of entities. Each measurement is based on 5 repetitions per entity count.
- Mean Execution Times: Shows the average time taken by each approach as the workload scales from 10M to 50M entities.
- Population Standard Deviation: Highlights the variability of execution times across multiple runs, indicating the consistency of each approach.
- Minimum and Maximum Execution Times: Displays the observed range of execution times for each approach, illustrating the spread and potential outliers in performance.
Together, these tables provide a clear view of both the speed and stability of each implementation strategy.
The following table summarise the mean execution times (in seconds) as the workload scales from 10M to 50M entities:
| Entities | OOP-Pure (s) | DOD-Scalar (s) | DOD-SSE (s) | DOD-AVX (s) |
|---|---|---|---|---|
| 10,000,000 | 0.0716 | 0.0190 | 0.0145 | 0.0140 |
| 20,000,000 | 0.2257 | 0.0412 | 0.0356 | 0.0325 |
| 30,000,000 | 0.4375 | 0.0626 | 0.0544 | 0.0490 |
| 40,000,000 | 0.7341 | 0.0827 | 0.0698 | 0.0646 |
| 50,000,000 | 2.2936 | 0.2101 | 0.1623 | 0.0949 |
The next table summarises the population standard deviation of execution times for each approach (OOP-Pure, DOD-Scalar, DOD-SSE, DOD-AVX) across 10M to 50M numbers of entities.
The population standard deviation captures both the variability and dispersion of execution times across the five runs, providing insight into the consistency of each approach.
| Entities | OOP-Pure PopStdDev (s) | DOD-Scalar PopStdDev (s) | DOD-SSE PopStdDev (s) | DOD-AVX PopStdDev (s) |
|---|---|---|---|---|
| 10,000,000 | 0.0025 | 0.0005 | 0.0005 | 0.0002 |
| 20,000,000 | 0.0126 | 0.0035 | 0.0065 | 0.0012 |
| 30,000,000 | 0.0206 | 0.0100 | 0.0110 | 0.0012 |
| 40,000,000 | 0.0451 | 0.0090 | 0.0100 | 0.0046 |
| 50,000,000 | 2.0003 | 0.1890 | 0.1455 | 0.0225 |
The next table shows the minimum and maximum execution times recorded for each approach (OOP-Pure, DOD-Scalar, DOD-SSE, DOD-AVX) across 10M to 50M entities, illustrating the range and variability of performance.
| Entities | OOP-Pure Min/Max (s) | DOD-Scalar Min/Max (s) | DOD-SSE Min/Max (s) | DOD-AVX Min/Max (s) |
|---|---|---|---|---|
| 10,000,000 | 0.0690 / 0.0759 | 0.0184 / 0.0196 | 0.0142 / 0.0156 | 0.0138 / 0.0144 |
| 20,000,000 | 0.2103 / 0.2465 | 0.0386 / 0.0480 | 0.0300 / 0.0480 | 0.0310 / 0.0347 |
| 30,000,000 | 0.4154 / 0.4693 | 0.0539 / 0.0781 | 0.0456 / 0.0760 | 0.0473 / 0.0509 |
| 40,000,000 | 0.6921 / 0.8205 | 0.0760 / 0.1004 | 0.0589 / 0.0834 | 0.0589 / 0.0729 |
| 50,000,000 | 1.0400 / 6.2526 | 0.0949 / 0.5862 | 0.0740 / 0.4509 | 0.0735 / 0.1234 |
Analysis of the Tabulated Results
The mean execution time table shows a clear and consistent performance gap between the different approaches as the number of entities increases from 10M to 50M. The OOP-Pure implementation exhibits the highest execution times and the steepest growth curve, indicating limited scalability under increasing workloads. In contrast, all DOD-based approaches scale more efficiently, with significantly lower execution times across all entity counts.
Among the DOD variants, DOD-Scalar already provides a substantial improvement over OOP-Pure, highlighting the benefits of improved memory layout and data locality alone. The introduction of SIMD further enhances performance: DOD-SSE consistently outperforms the scalar version, while DOD-AVX achieves the best results overall, particularly at higher entity counts, where the computational workload is large enough to fully amortize SIMD overheads.
The population standard deviation table provides insight into the stability and consistency of each approach. OOP-Pure shows noticeably higher variability, especially at 40M and 50M entities, suggesting less predictable execution times and higher sensitivity to system-level effects such as cache behavior and memory access patterns. In contrast, the DOD implementations, especially DOD-AVX exhibit much lower standard deviation values, indicating more stable and deterministic performance across the five repetitions.
This behavior is further reinforced by the minimum and maximum execution time ranges. OOP-Pure displays a wide spread between minimum and maximum values, most notably at 50M entities, where the maximum time is several times larger than the minimum. The DOD-based approaches show significantly tighter ranges, with DOD-AVX maintaining the narrowest min/max spread across all workloads. This suggests not only faster execution but also improved robustness against performance fluctuations.
Overall, the tabulated results demonstrate that Data-Oriented Design combined with SIMD provides both superior scalability and more consistent execution times compared to a traditional OOP approach.
In Summary
Scalability Trends
- OOP_Pure exhibits the highest execution times and the steepest growth curve, indicating limited scalability under increasing workloads.
- In contrast, all DOD-based approaches scale more efficiently, with significantly lower execution times across all entity counts.
Impact of Data-Oriented Design and SIMD
Among the DOD variants:
- DOD-Scalar already provides a substantial improvement over OOP-Pure, highlighting the benefits of improved memory layout and data locality.
- The introduction of SIMD further enhances performance:
- DOD-SSE consistently outperforms the scalar version.
- DOD-AVX achieves the best overall results, particularly at higher entity counts, where the computational workload is large enough to amortize SIMD overheads.
Execution Time Stability
The population standard deviation table provides insight into performance consistency:
- OOP-Pure shows noticeably higher variability, especially at 40M and 50M entities, suggesting less predictable execution times and higher sensitivity to cache behaviour and memory access patterns.
- The DOD implementations, especially DOD-AVX, exhibit much lower standard deviation values, indicating more stable and deterministic performance across the five repetitions.
This trend is reinforced by the minimum and maximum execution time ranges:
- OOP-Pure displays a wide spread between minimum and maximum values, most notably at 50M entities, where the maximum time is several times larger than the minimum.
- DOD-based approaches show significantly tighter ranges, with DOD_AVX maintaining the narrowest spread across all workloads.
Conclusion
Overall, the tabulated results demonstrate that Data-Oriented Design combined with SIMD provides both superior scalability and more consistent execution times compared to a traditional OOP approach. These trends are further illustrated and reinforced in the following graphical representations.
Benchmark Graphs
Technical Note: The charts are generated using GNU Octave. with this script
In the figures 1 and 4, the Y-axis utilises a Log10 scale to ensure sufficient resolution for the DOD and SIMD results. Without this scaling, the DOD variants would appear overlapped at the bottom of the plot, obscuring the significant performance differences between Scalar, SSE, and AVX.
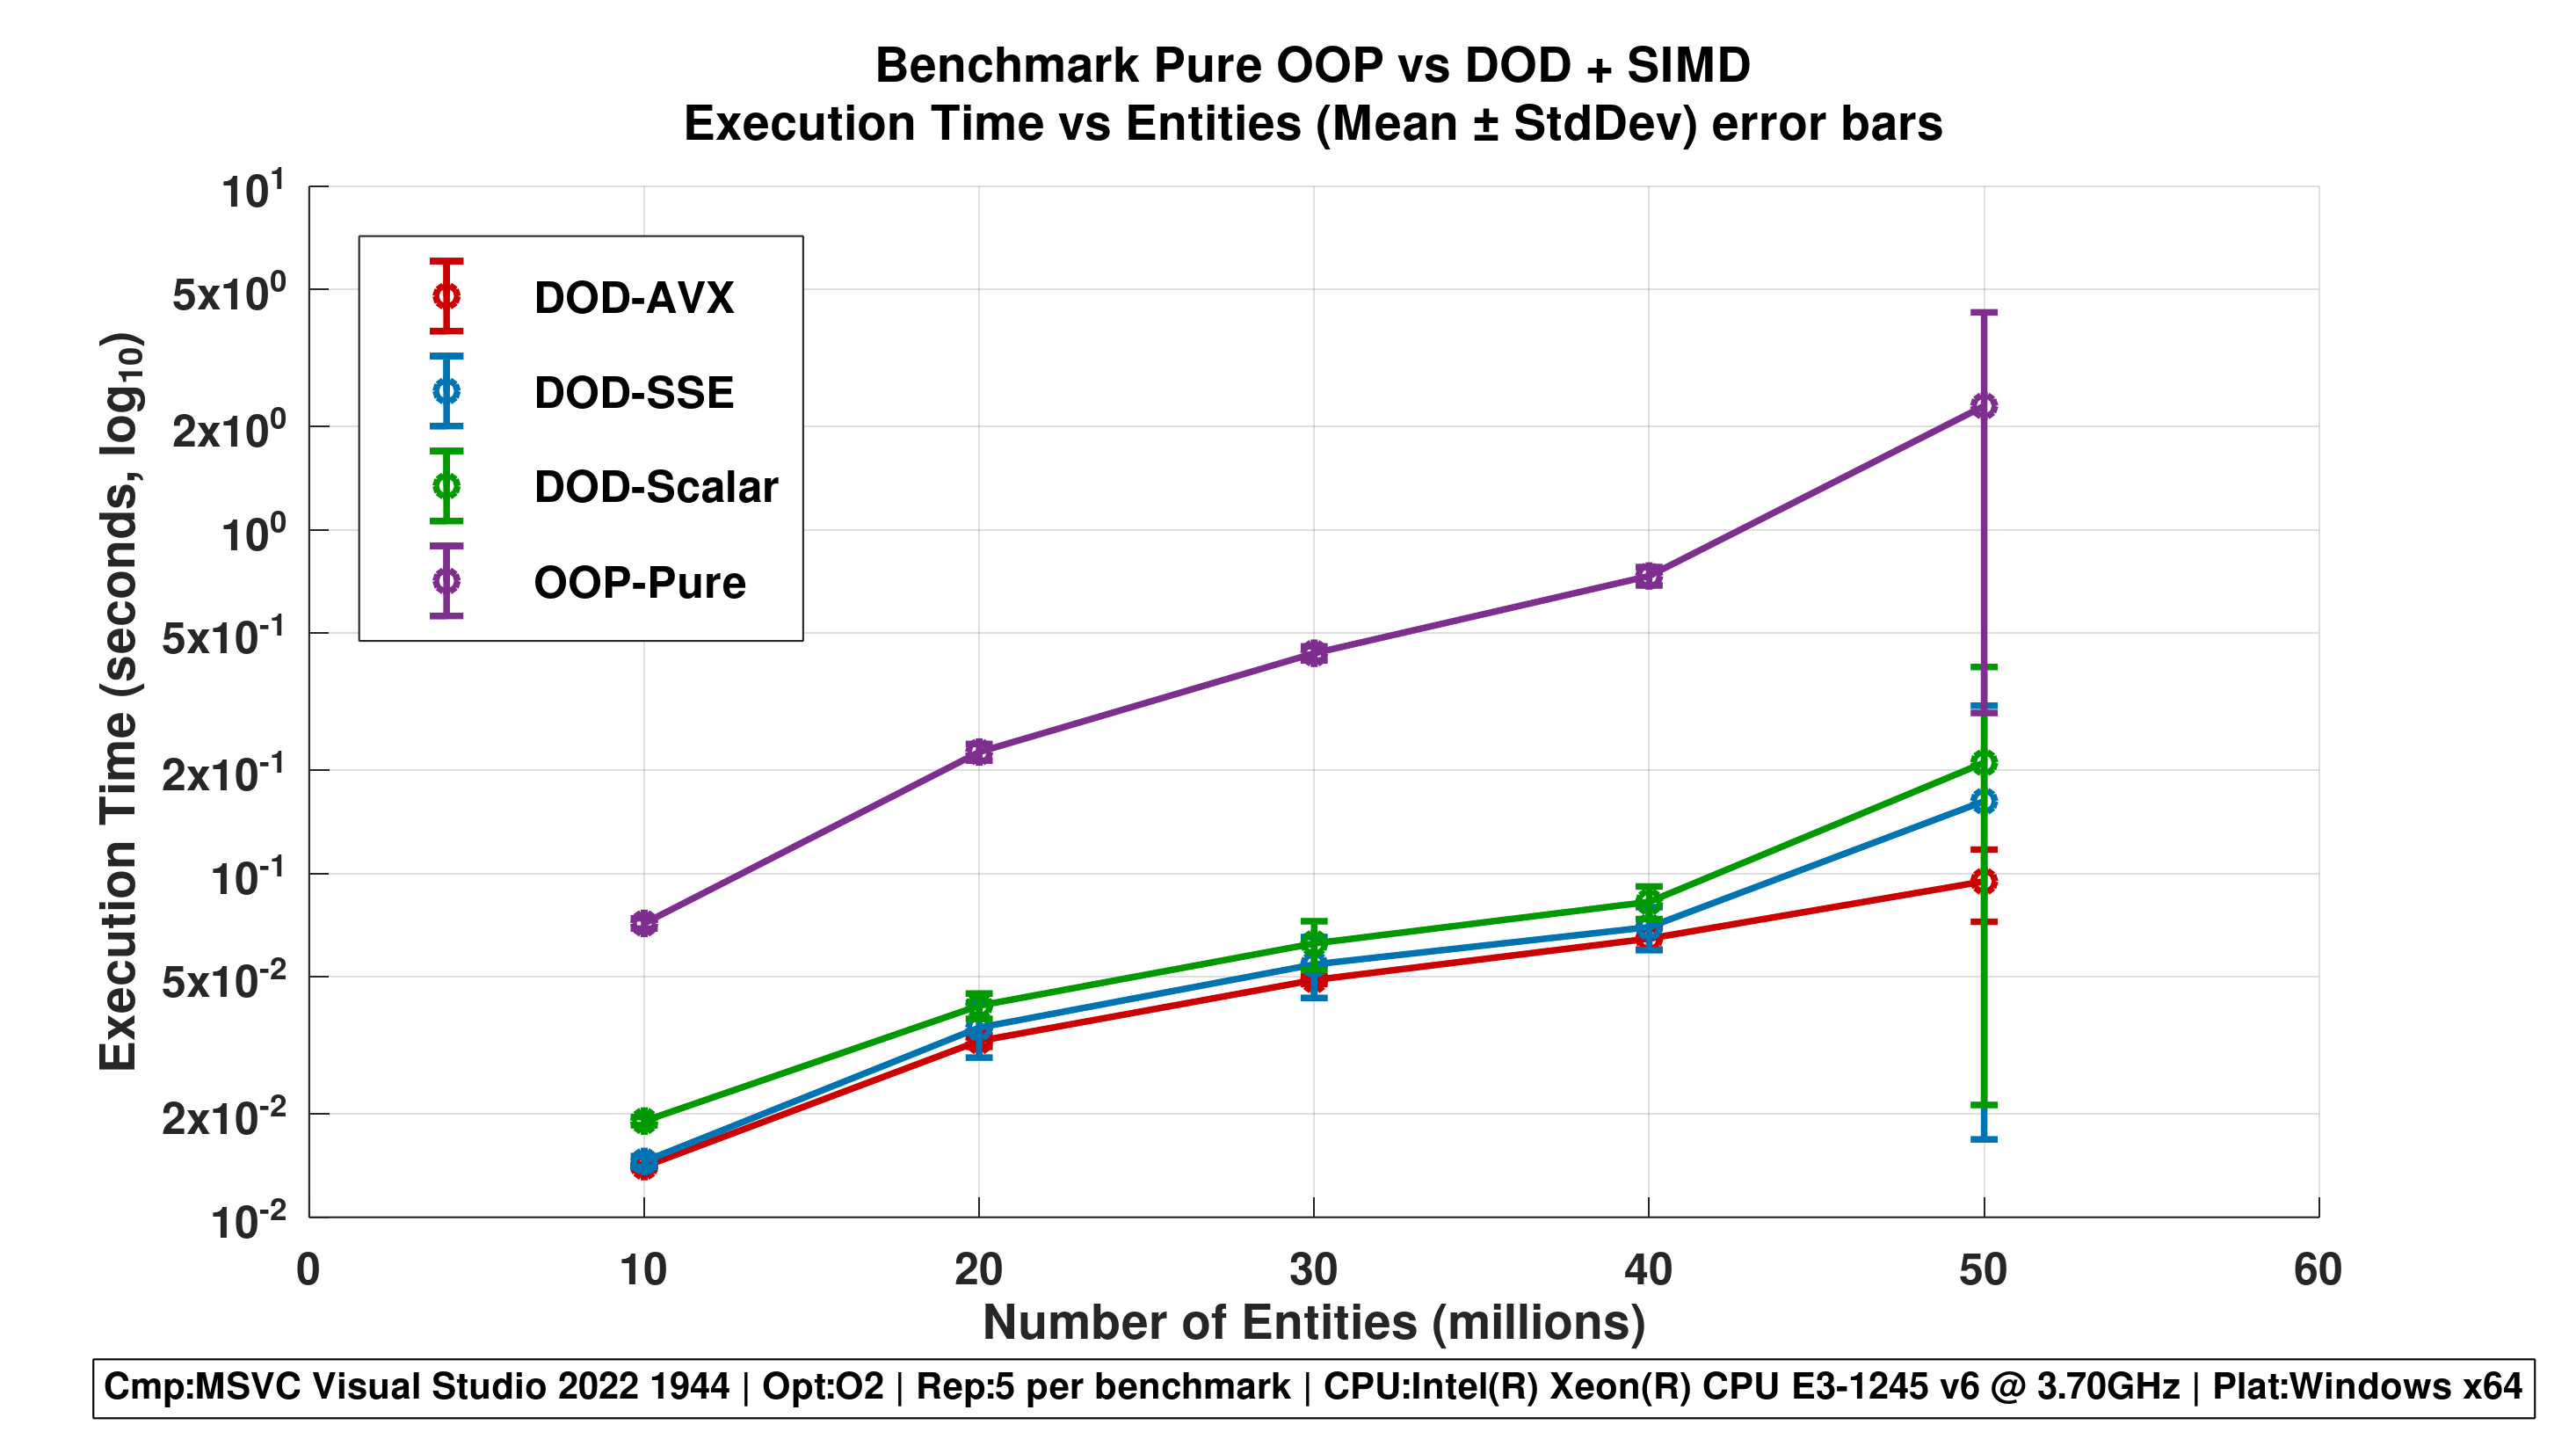
Figure 1 - Execution Time vs Entities (Mean ± StdDev)
Mean execution time as a function of the number of entities, with error bars representing the population standard deviation ($\sigma$) across five runs. This figure highlights both scalability and execution time stability for each approach.

Figure 2 - Grouped Bar Chart (Mean Values)
Grouped bar chart comparing the mean execution times of OOP-Pure, DOD-Scalar, DOD-SSE, and DOD-AVX for each entity count. This visualization emphasizes the relative performance differences between approaches at each workload size.
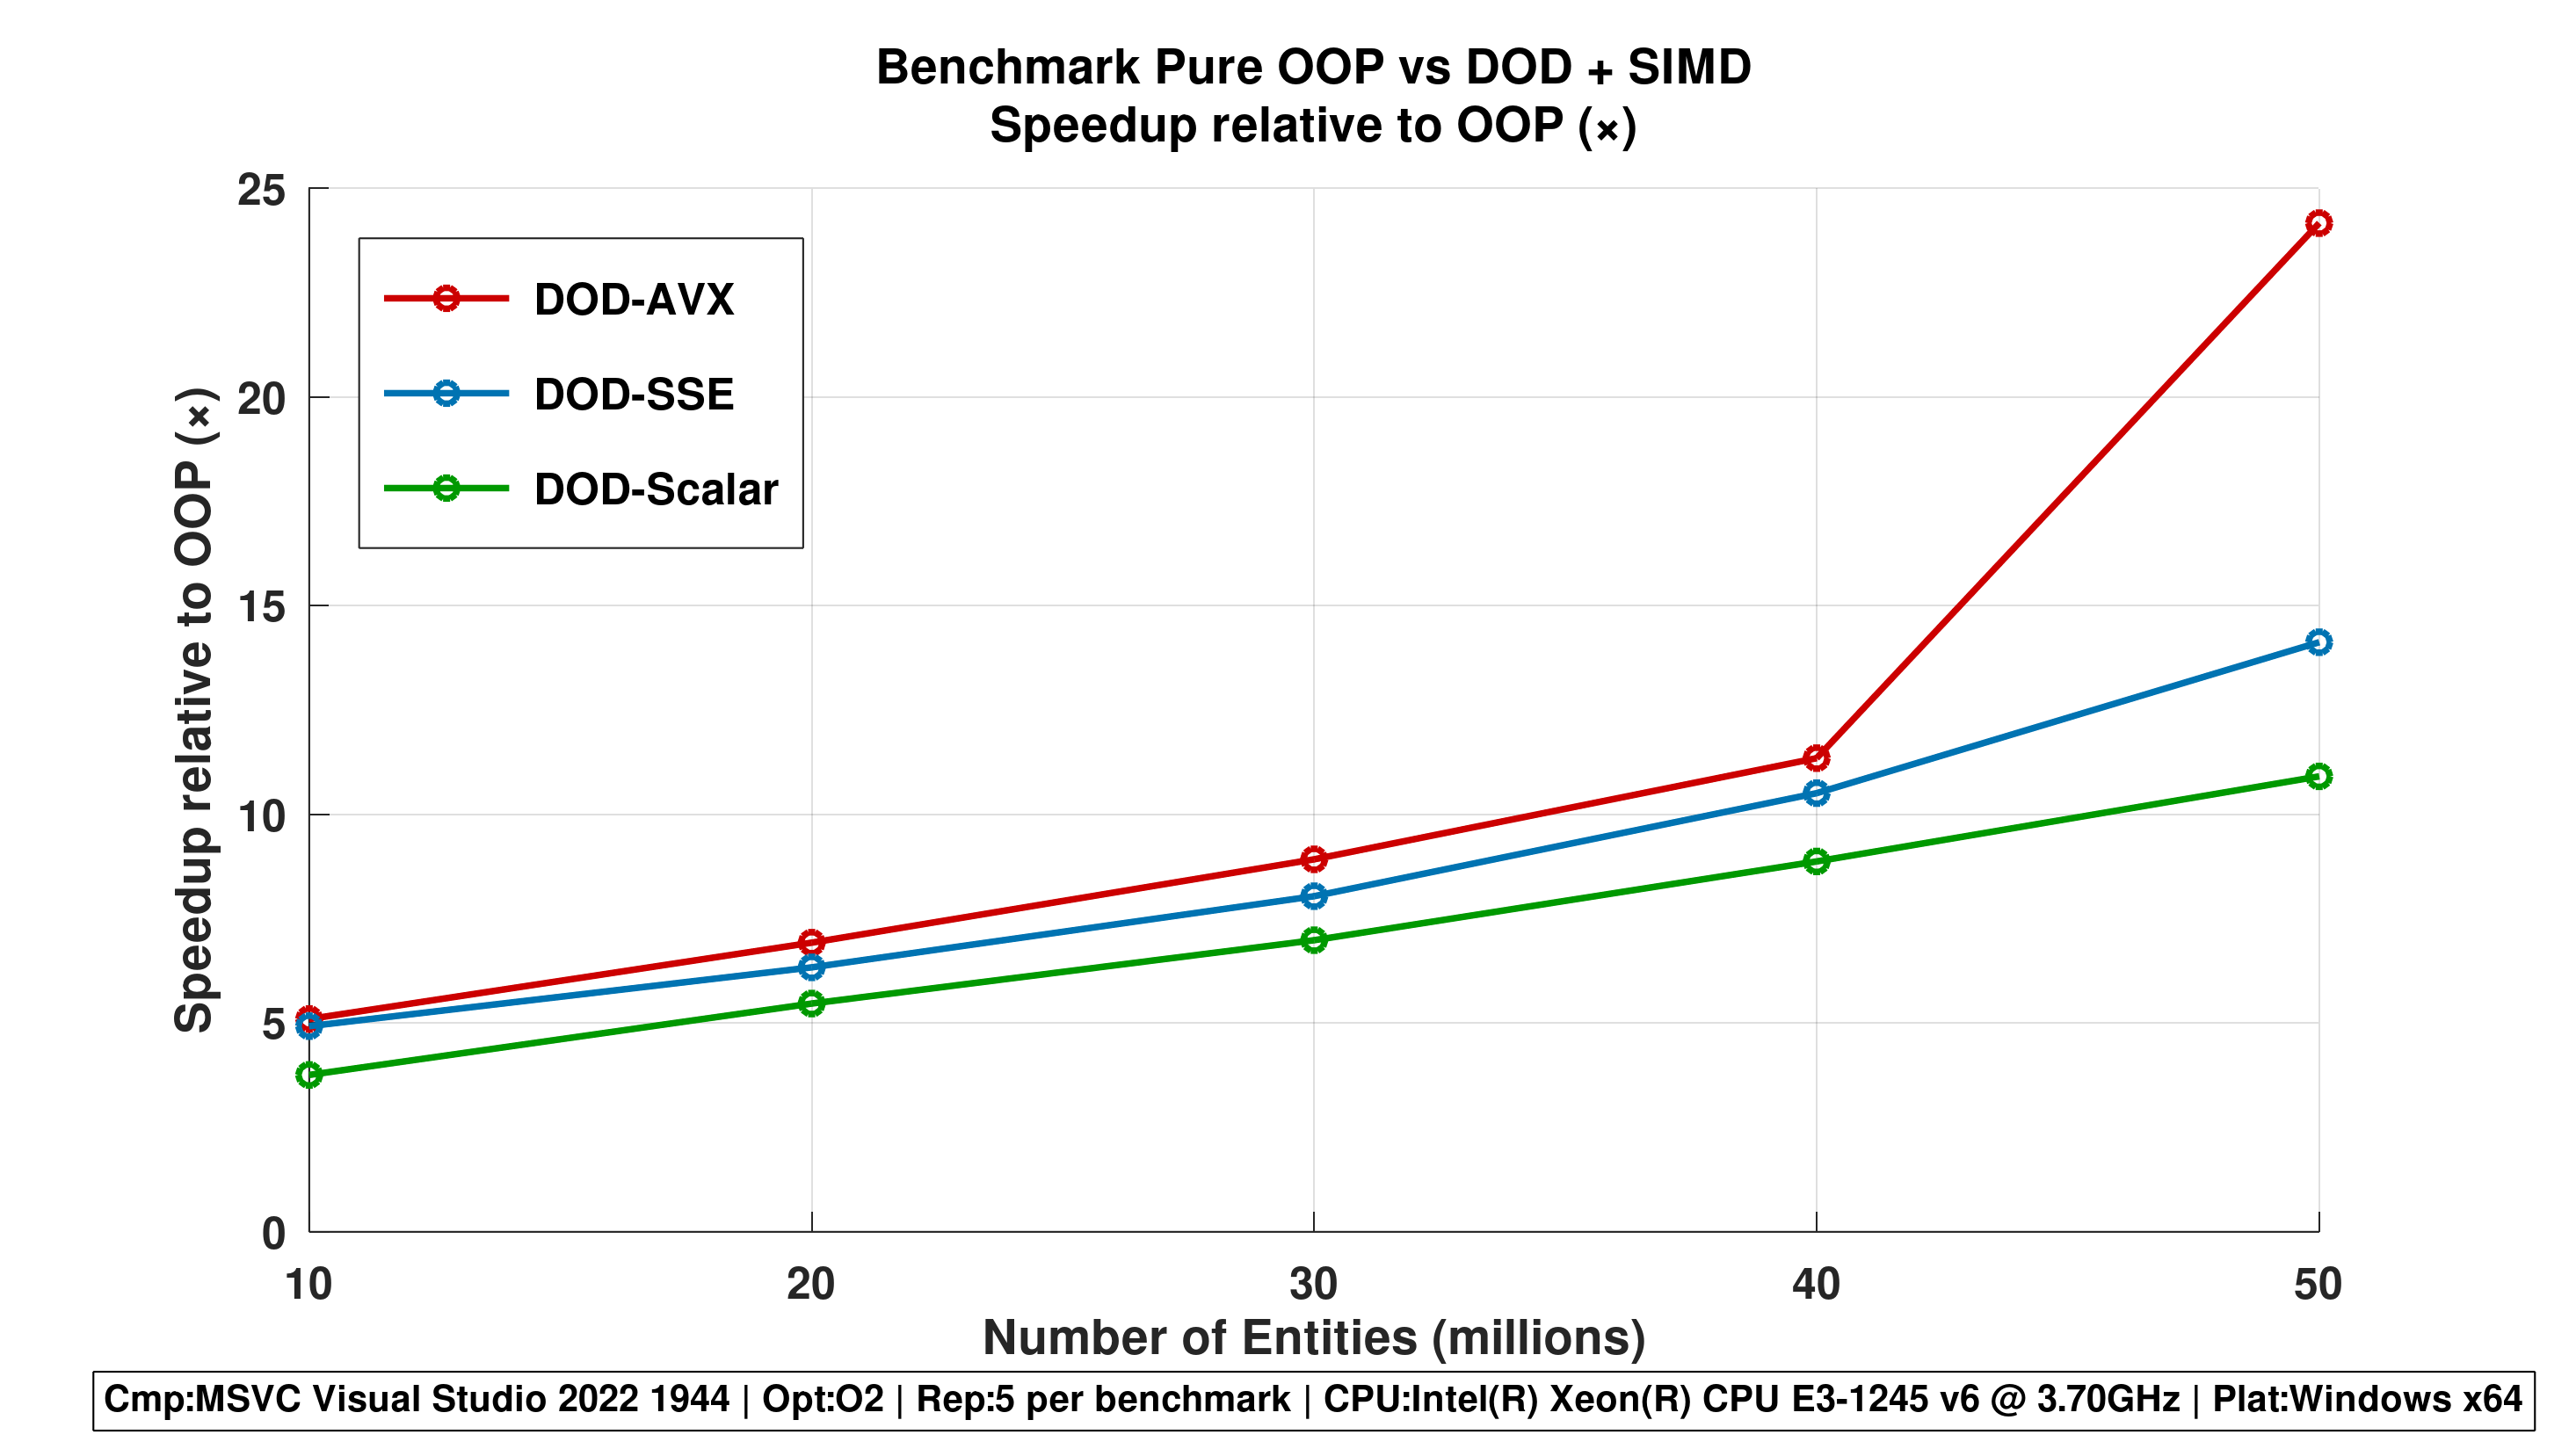
Figure 3 - Speedup Relative to OOP (×)
Speedup of each DOD-based approach relative to the OOP-Pure baseline, computed from mean execution times. Values greater than 1 indicate performance improvements over the OOP implementation, illustrating the benefits of data-oriented design and SIMD.
Figure 3 illustrates how much faster each Data-Oriented Design (DOD) approach performs compared to the baseline OOP-Pure implementation as the number of entities increases from 10M to 50M.
The speedup is computed as the ratio between the execution time of OOP-Pure and the execution time of each alternative method. Therefore, a value greater than 1 indicates a performance improvement over OOP-Pure, while higher values correspond to larger gains.
The OOP-Pure implementation is used solely as a reference baseline and is not explicitly plotted in this figure.
Across all workloads, the DOD-based approaches show steadily increasing speedup as the workload scales. This behaviour indicates that these implementations scale efficiently with the number of entities, benefiting from improved memory locality and more efficient data access patterns.
The DOD-Scalar implementation already achieves significant speedups, reaching approximately 10× faster execution at 50M entities. This demonstrates that structural data layout changes alone (without SIMD) provide substantial performance benefits.
The SIMD-enabled variants further amplify this effect. DOD-SSE improves upon the scalar version, but its gains are moderate and show some variability, which aligns with the higher dispersion observed in its execution times. In contrast, DOD-AVX exhibits the highest and most stable speedup across all tested workloads, reaching over 20× speedup at 50M entities.
The SIMD-enabled variants further amplify these gains. DOD-SSE improves upon the scalar version, although its speedup growth is more moderate and shows some variability at higher workloads. In contrast, DOD-AVX consistently achieves the highest speedup across all tested workloads, exceeding 20× at 50M entities.
Overall, the figure highlights the effectiveness of Data-Oriented Design and SIMD vectorization for large-scale workloads, showing that wider vector units combined with cache-friendly data layouts lead to superior scalability, reduced execution time, and more predictable performance behaviour as problem size increases. This is due to organizing data contiguously in memory and aligning computations with wide SIMD vector units, these approaches reduce cache misses and memory access overhead. This results in superior scalability, lower execution times, and more predictable performance as the number of entities increases.
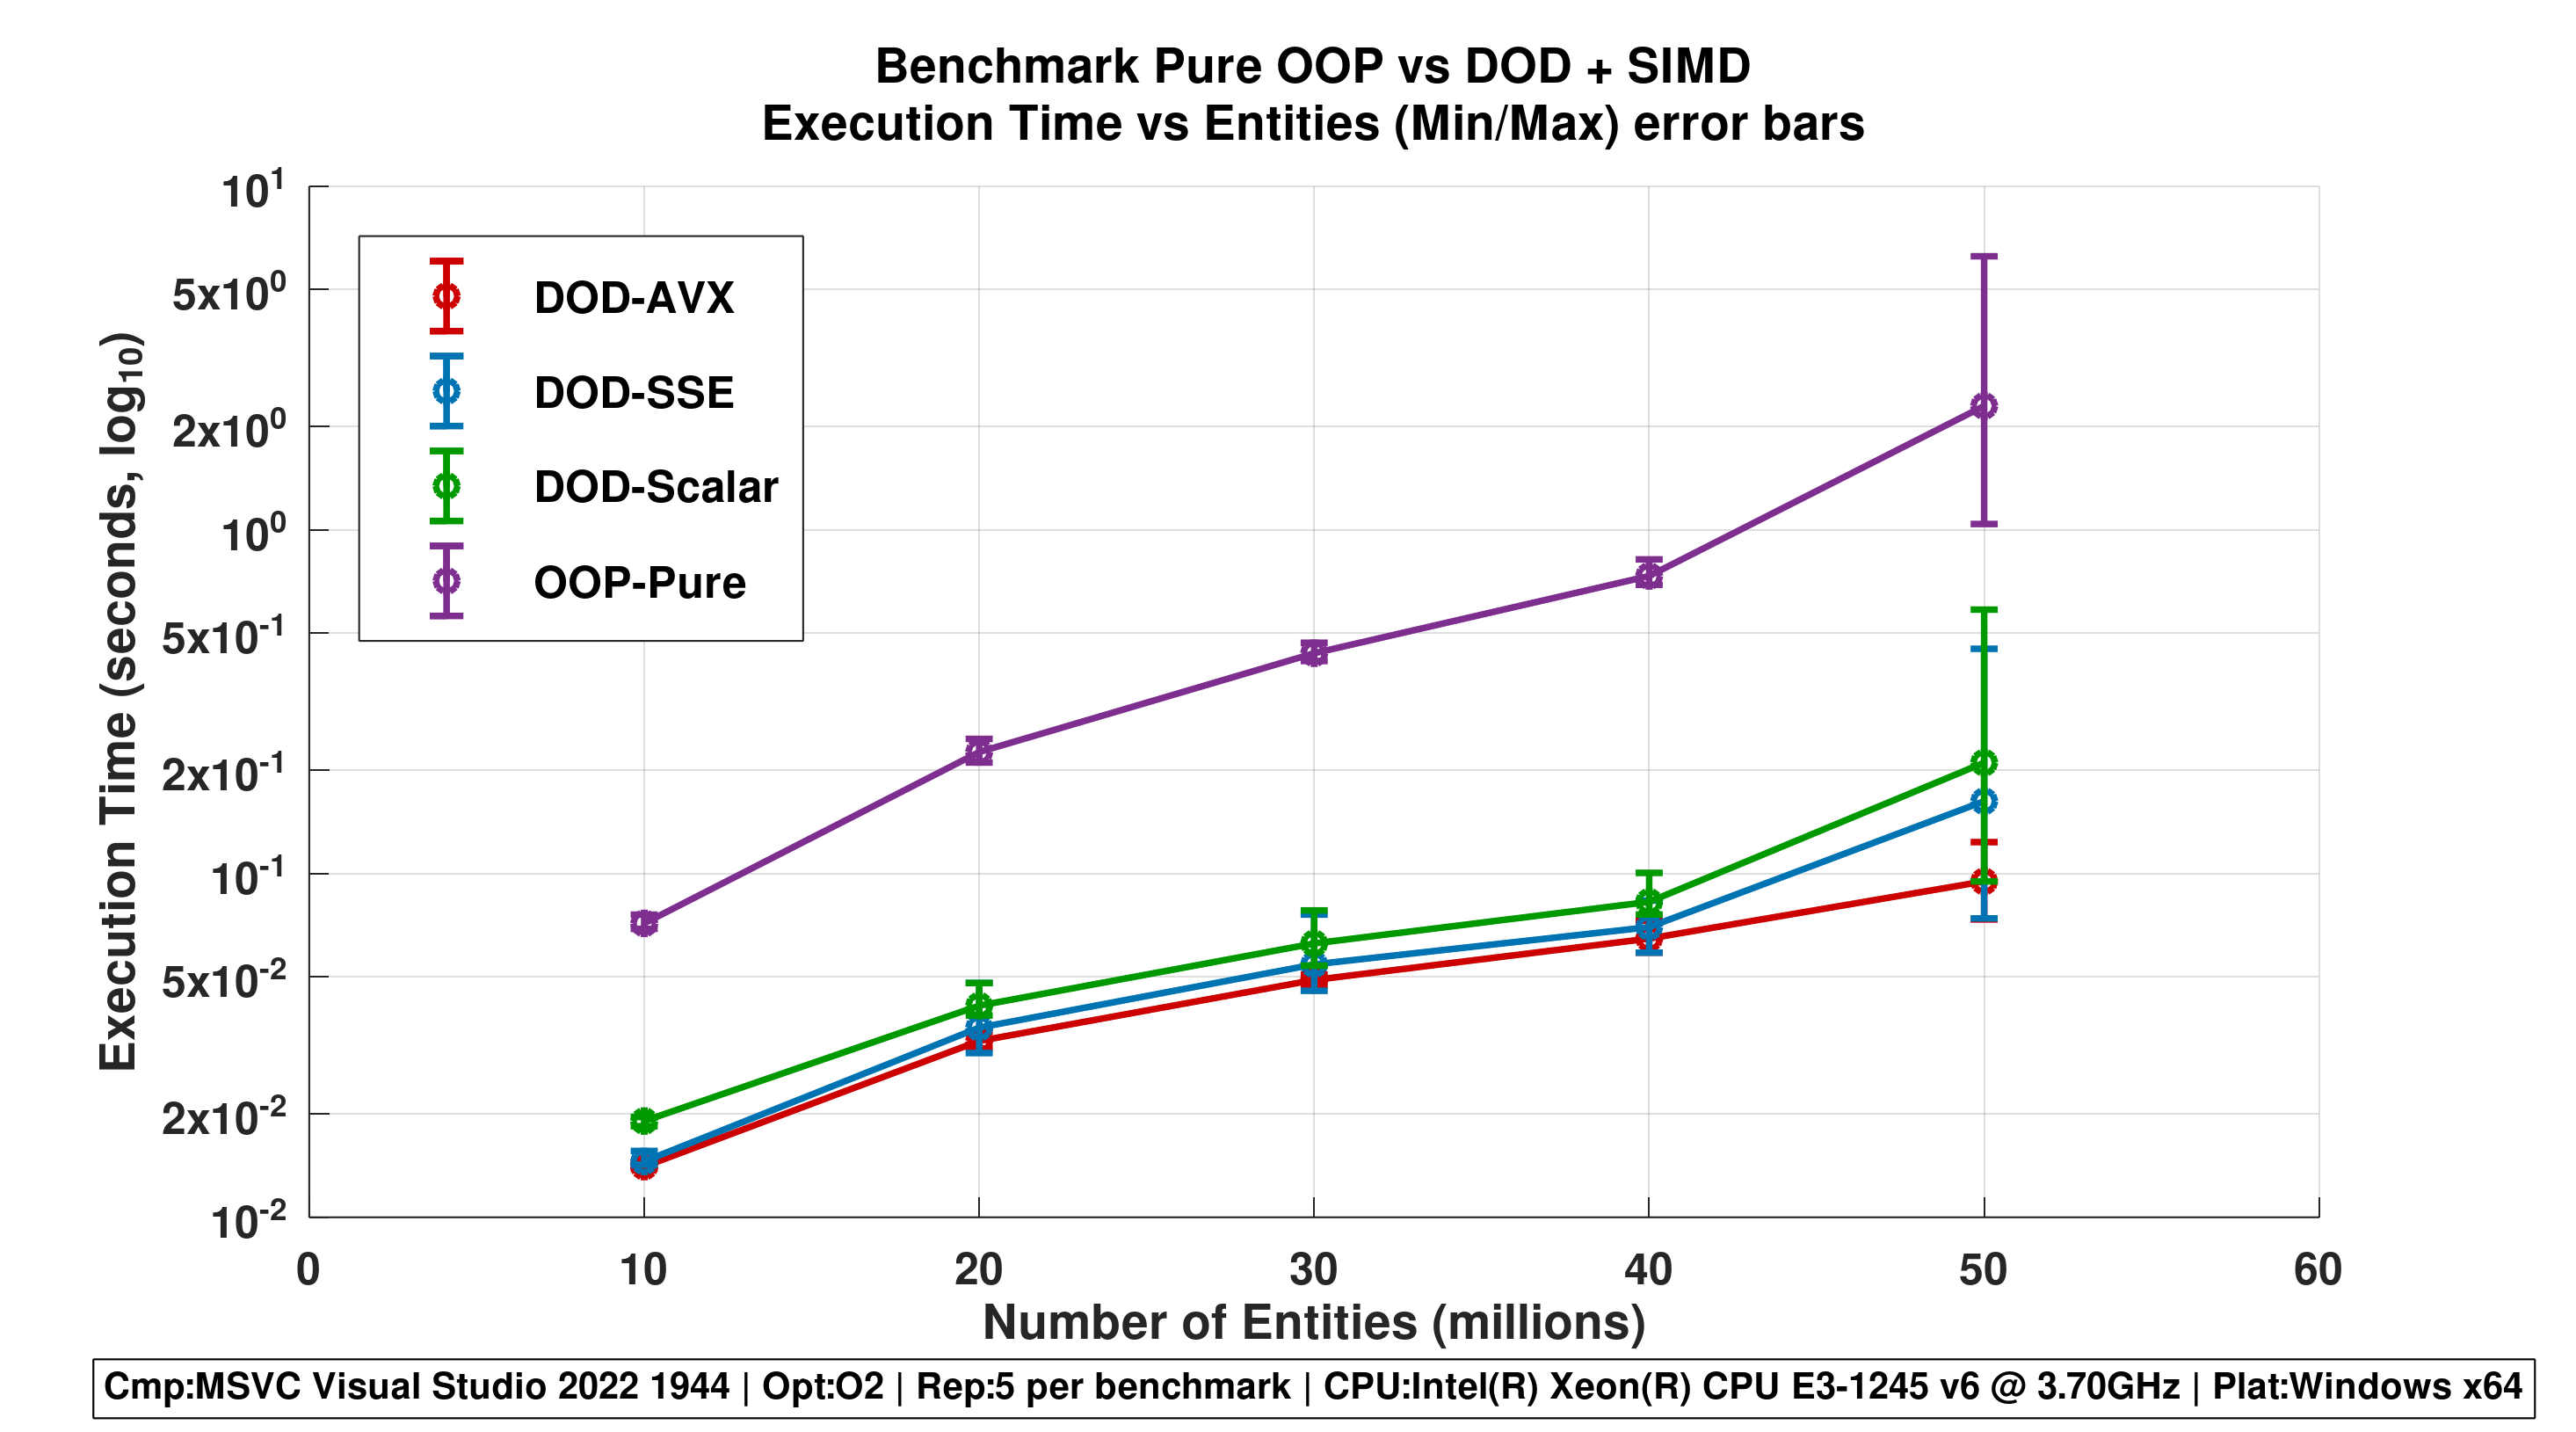
Figure 4 - Execution Time Range (Min/Max)
Execution time ranges for each approach across different numbers of entities, shown using minimum and maximum values measured over five runs. This figure illustrates performance variability and highlights differences in execution time consistency.
Note:
A more detailed statistical analysis comparing 1, 5, and 10 repetitions - including execution time variability, min/max ranges, and stability considerations is available in Benchmark MSVC Windows comparison DOD SIMD vs OOP r1 r5 r10 analysis
Authored by: > Xavier Figuera - 2025 > LinkedIn